Insight Report
Top 10 Best Protein-Per-Calorie Restaurant Meals
The most protein-dense meals - highest protein per calorie - across UK chains.
Ranked by protein per kcal, with a 15g minimum protein floor so the list rewards substantial meals rather than tiny snacks.
Top 10 ranked
| Rank | Product | Brand | Score /100 | Calories (kcal) | Protein (g) | Fibre (g) | Sugar (g) | Salt (g) | Watch-outs |
|---|---|---|---|---|---|---|---|---|---|
| 1 | 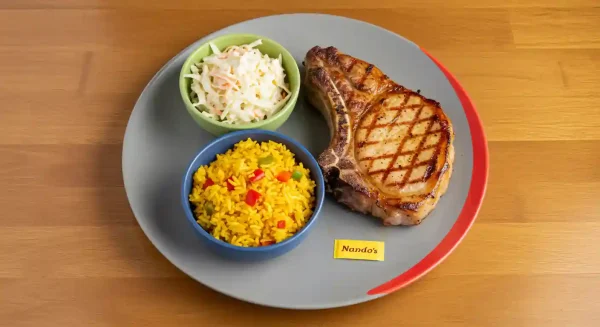 Chicken Butterfly Chicken Butterfly | Nandos | 84 | 331 | 59.3 | 1.5 | 0.0 | 1.3 | - |
| 2 | 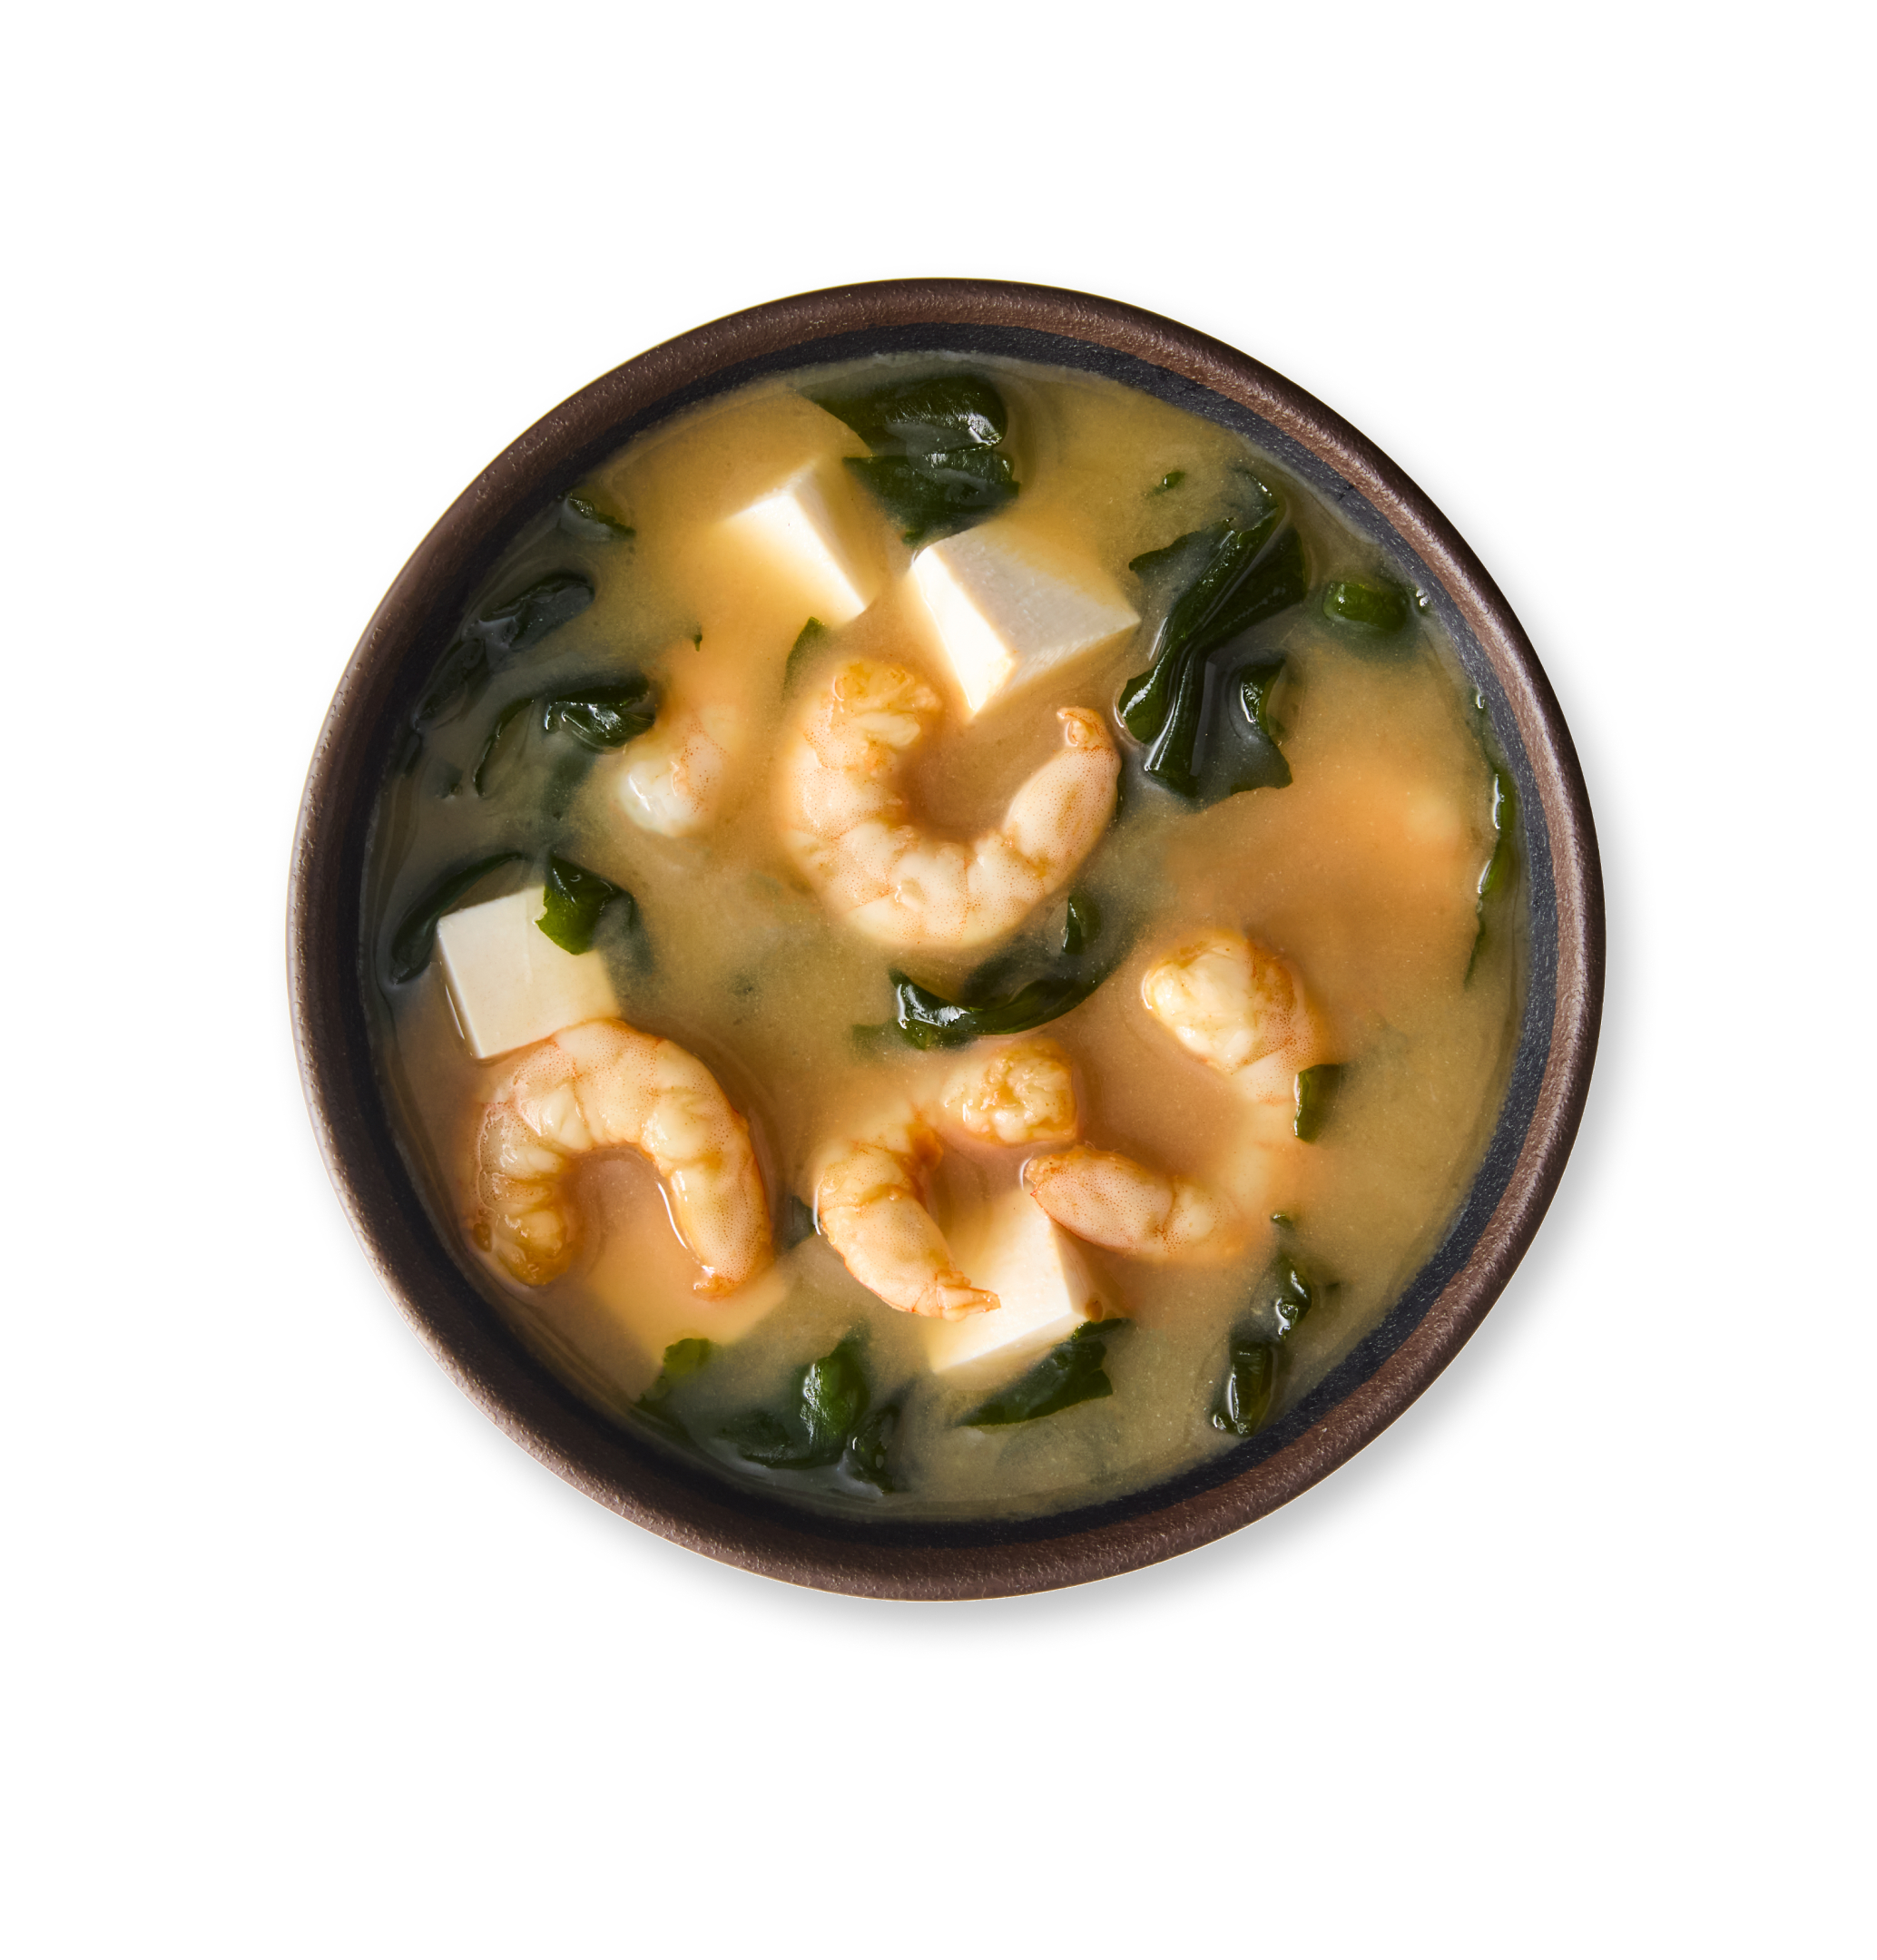 king prawn miso soup king prawn miso soup | itsu | 62 | 101 | 18.0 | 1.8 | 1.4 | 3.6 | Salt high |
| 3 | 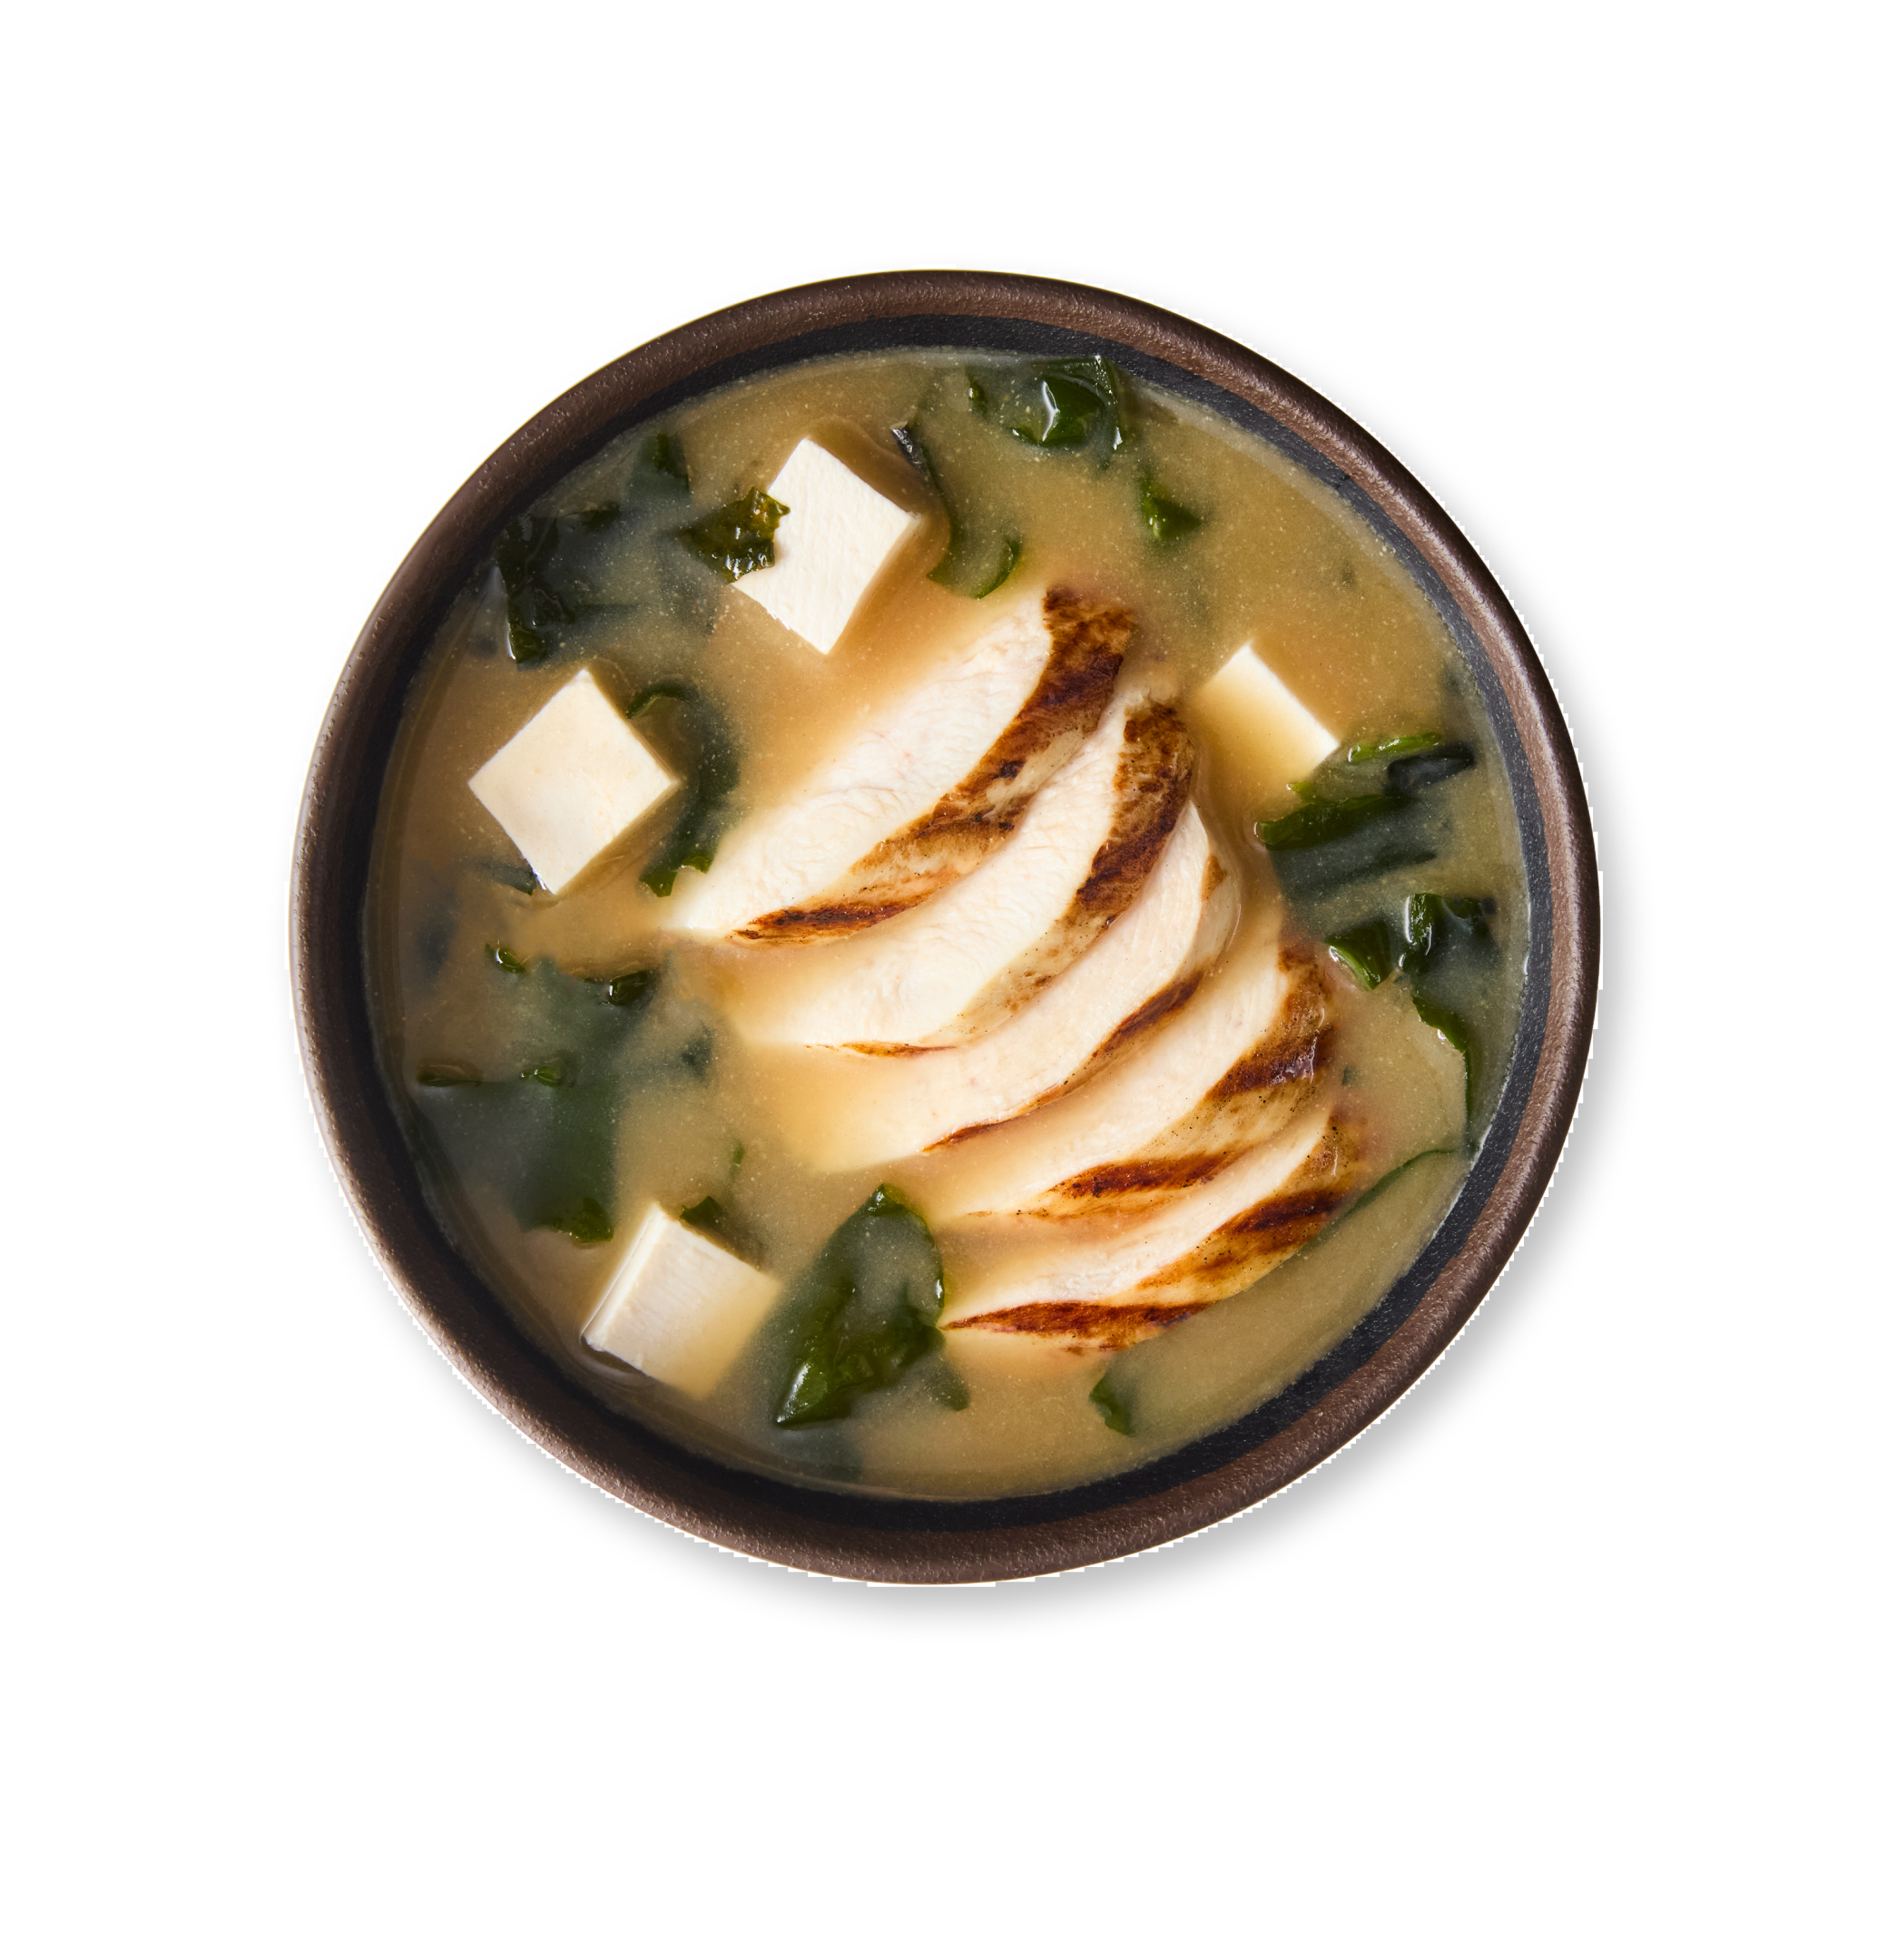 hot chargrilled chicken miso soup hot chargrilled chicken miso soup | itsu | 66 | 137 | 22.9 | 1.2 | 1.1 | 3.0 | Salt high |
| 4 | 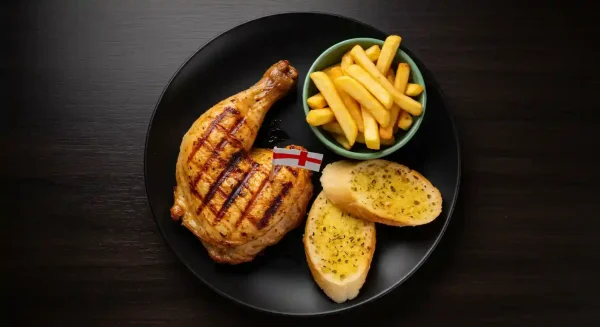 1/4 Chicken 1/4 Chicken | Nandos | 79 | 289 | 39.3 | 0.7 | 0.0 | 0.9 | - |
| 5 |  Whole Chicken Whole Chicken | Nandos | 49 | 1157 | 157.3 | 2.9 | 0.0 | 3.4 | Salt highSat fat high |
| 6 |  1/2 Chicken 1/2 Chicken | Nandos | 76 | 579 | 78.7 | 1.4 | 0.0 | 1.7 | Sat fat high |
| 7 |  3 Chicken Wings 3 Chicken Wings | Nandos | 80 | 235 | 31.9 | 0.7 | 0.0 | 1.4 | - |
| 8 |  5 Chicken Wings 5 Chicken Wings | Nandos | 76 | 392 | 53.2 | 1.2 | 0.0 | 2.3 | Salt high |
| 9 |  10 Chicken Wings 10 Chicken Wings | Nandos | 54 | 784 | 106.4 | 2.5 | 0.0 | 4.6 | Salt highSat fat high |
| 10 |  Wing Roulette Wing Roulette | Nandos | 52 | 821 | 106.6 | 2.8 | 0.5 | 5.3 | Salt highSat fat high |
About this ranking
Ranked by protein divided by calories. Minimum 15g protein per portion to exclude small snacks.
Methodology summary
The Healthier Score is a nutrition-based comparison score using published per-portion nutrition data.
Scores are combined using weighted averages. High levels of salt or saturated fat can cap the final score.
View full methodology →Watch-out key
- Salt highAbove 1.8g salt per serving
- Sat fat highAbove 5g saturated fat
- Fibre n/aFibre data not provided
- Score cappedScore reduced due to salt or sat fat
Brand breakdown
Number of top 10 appearances
- Nandos8
- itsu2
Did you know?
A protein-to-calorie ratio above 0.1g per kcal is typically considered very protein-dense.
Related insights
- More coming soon.
Important
The Healthier Score is not medical advice. It is a nutrition-based comparison score only. Always check the restaurant's latest nutrition, ingredients and allergen information before ordering.
Data caveats
Nutrition data is provided by restaurant brands and may change over time. Fibre is not always published. Where missing, a conservative fibre score is used.