Insight Report
Top 10 Meals With the Best Fibre-to-Calorie Ratio
Ranked from our published nutrition database using the Healthier Score, which compares per-portion calories, protein, fibre, sugar, salt and saturated fat.
Top 10 ranked
| Rank | Product | Brand | Score /100 | Calories (kcal) | Protein (g) | Fibre (g) | Sugar (g) | Salt (g) | Watch-outs |
|---|---|---|---|---|---|---|---|---|---|
| 1 | 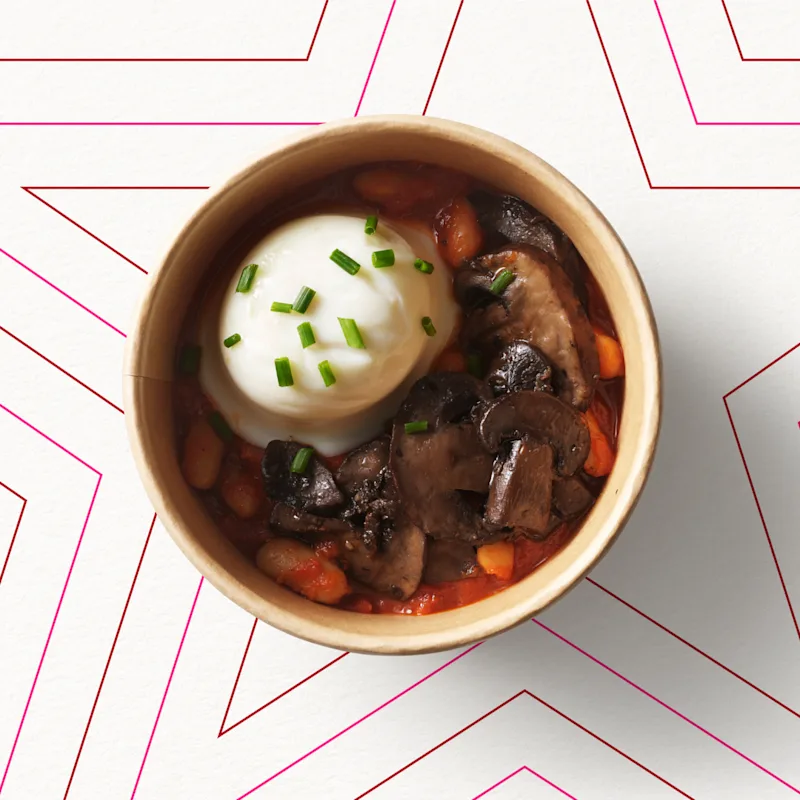 Roasted Mushroom, Pret's Baked Beans & Egg Pot Roasted Mushroom, Pret's Baked Beans & Egg Pot | pret | 85 | 191 | 14.1 | 15.1 | 5.7 | 1.1 | - |
| 2 | 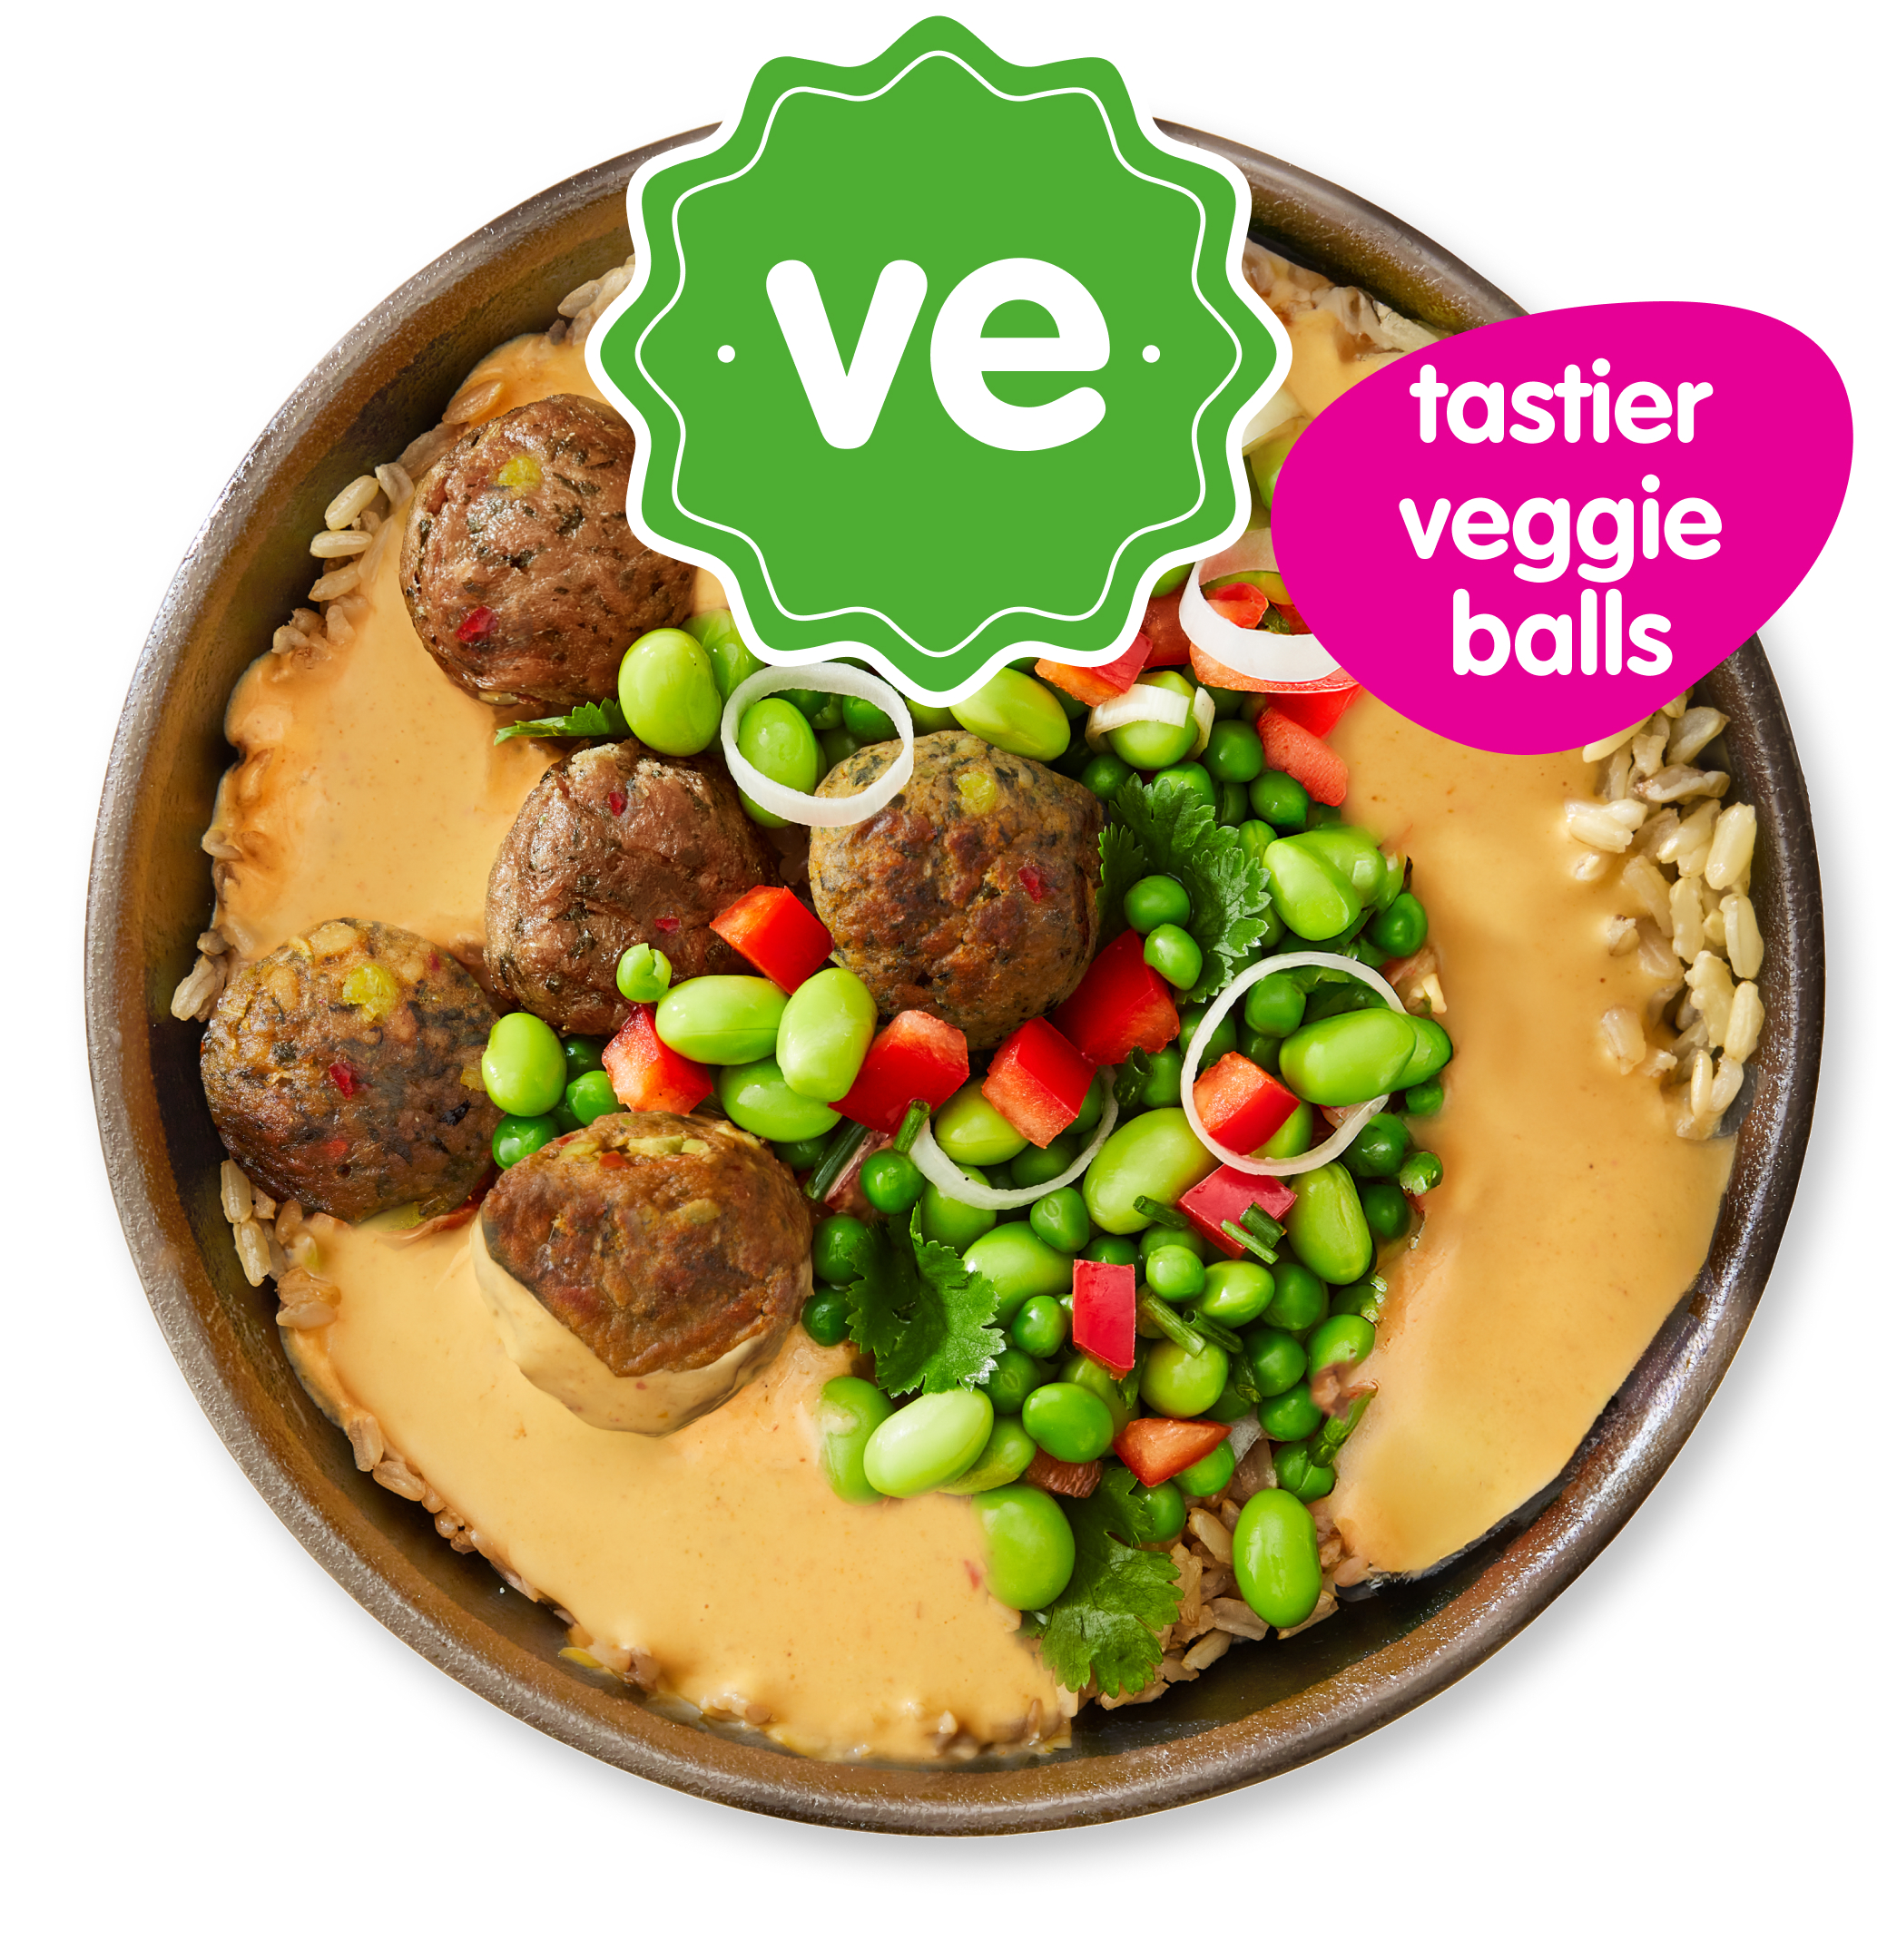 Thai veggie'balls curry Thai veggie'balls curry | itsu | 60 | 519 | 25.0 | 22.9 | 11.9 | 5.4 | Salt highSat fat high |
| 3 | 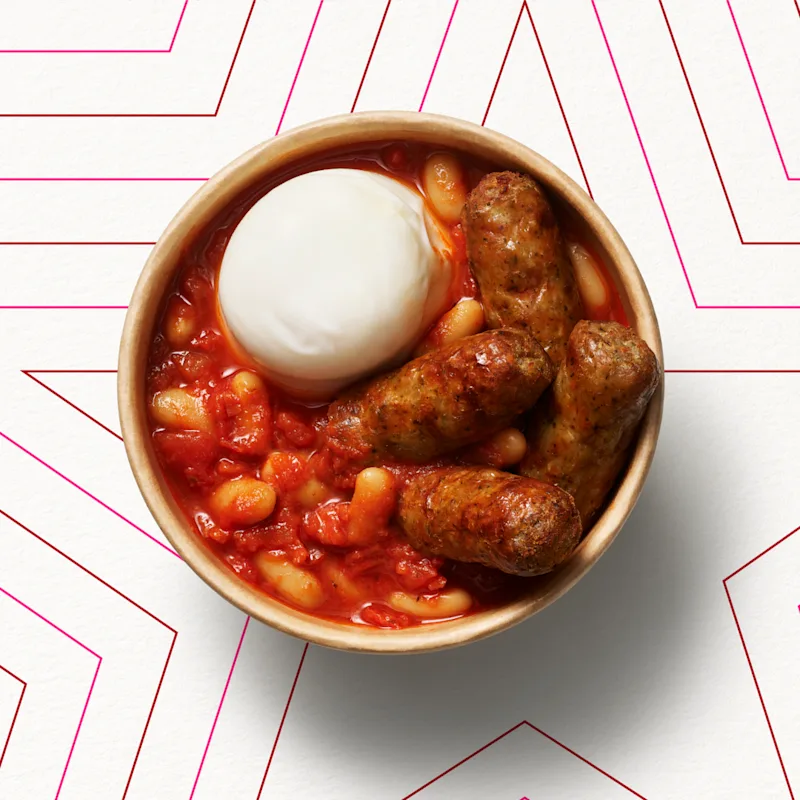 British Sausages, Pret's Baked Beans & Egg Pot British Sausages, Pret's Baked Beans & Egg Pot | pret | 78 | 342 | 22.1 | 14.9 | 6.4 | 1.7 | Sat fat highScore capped |
| 4 | 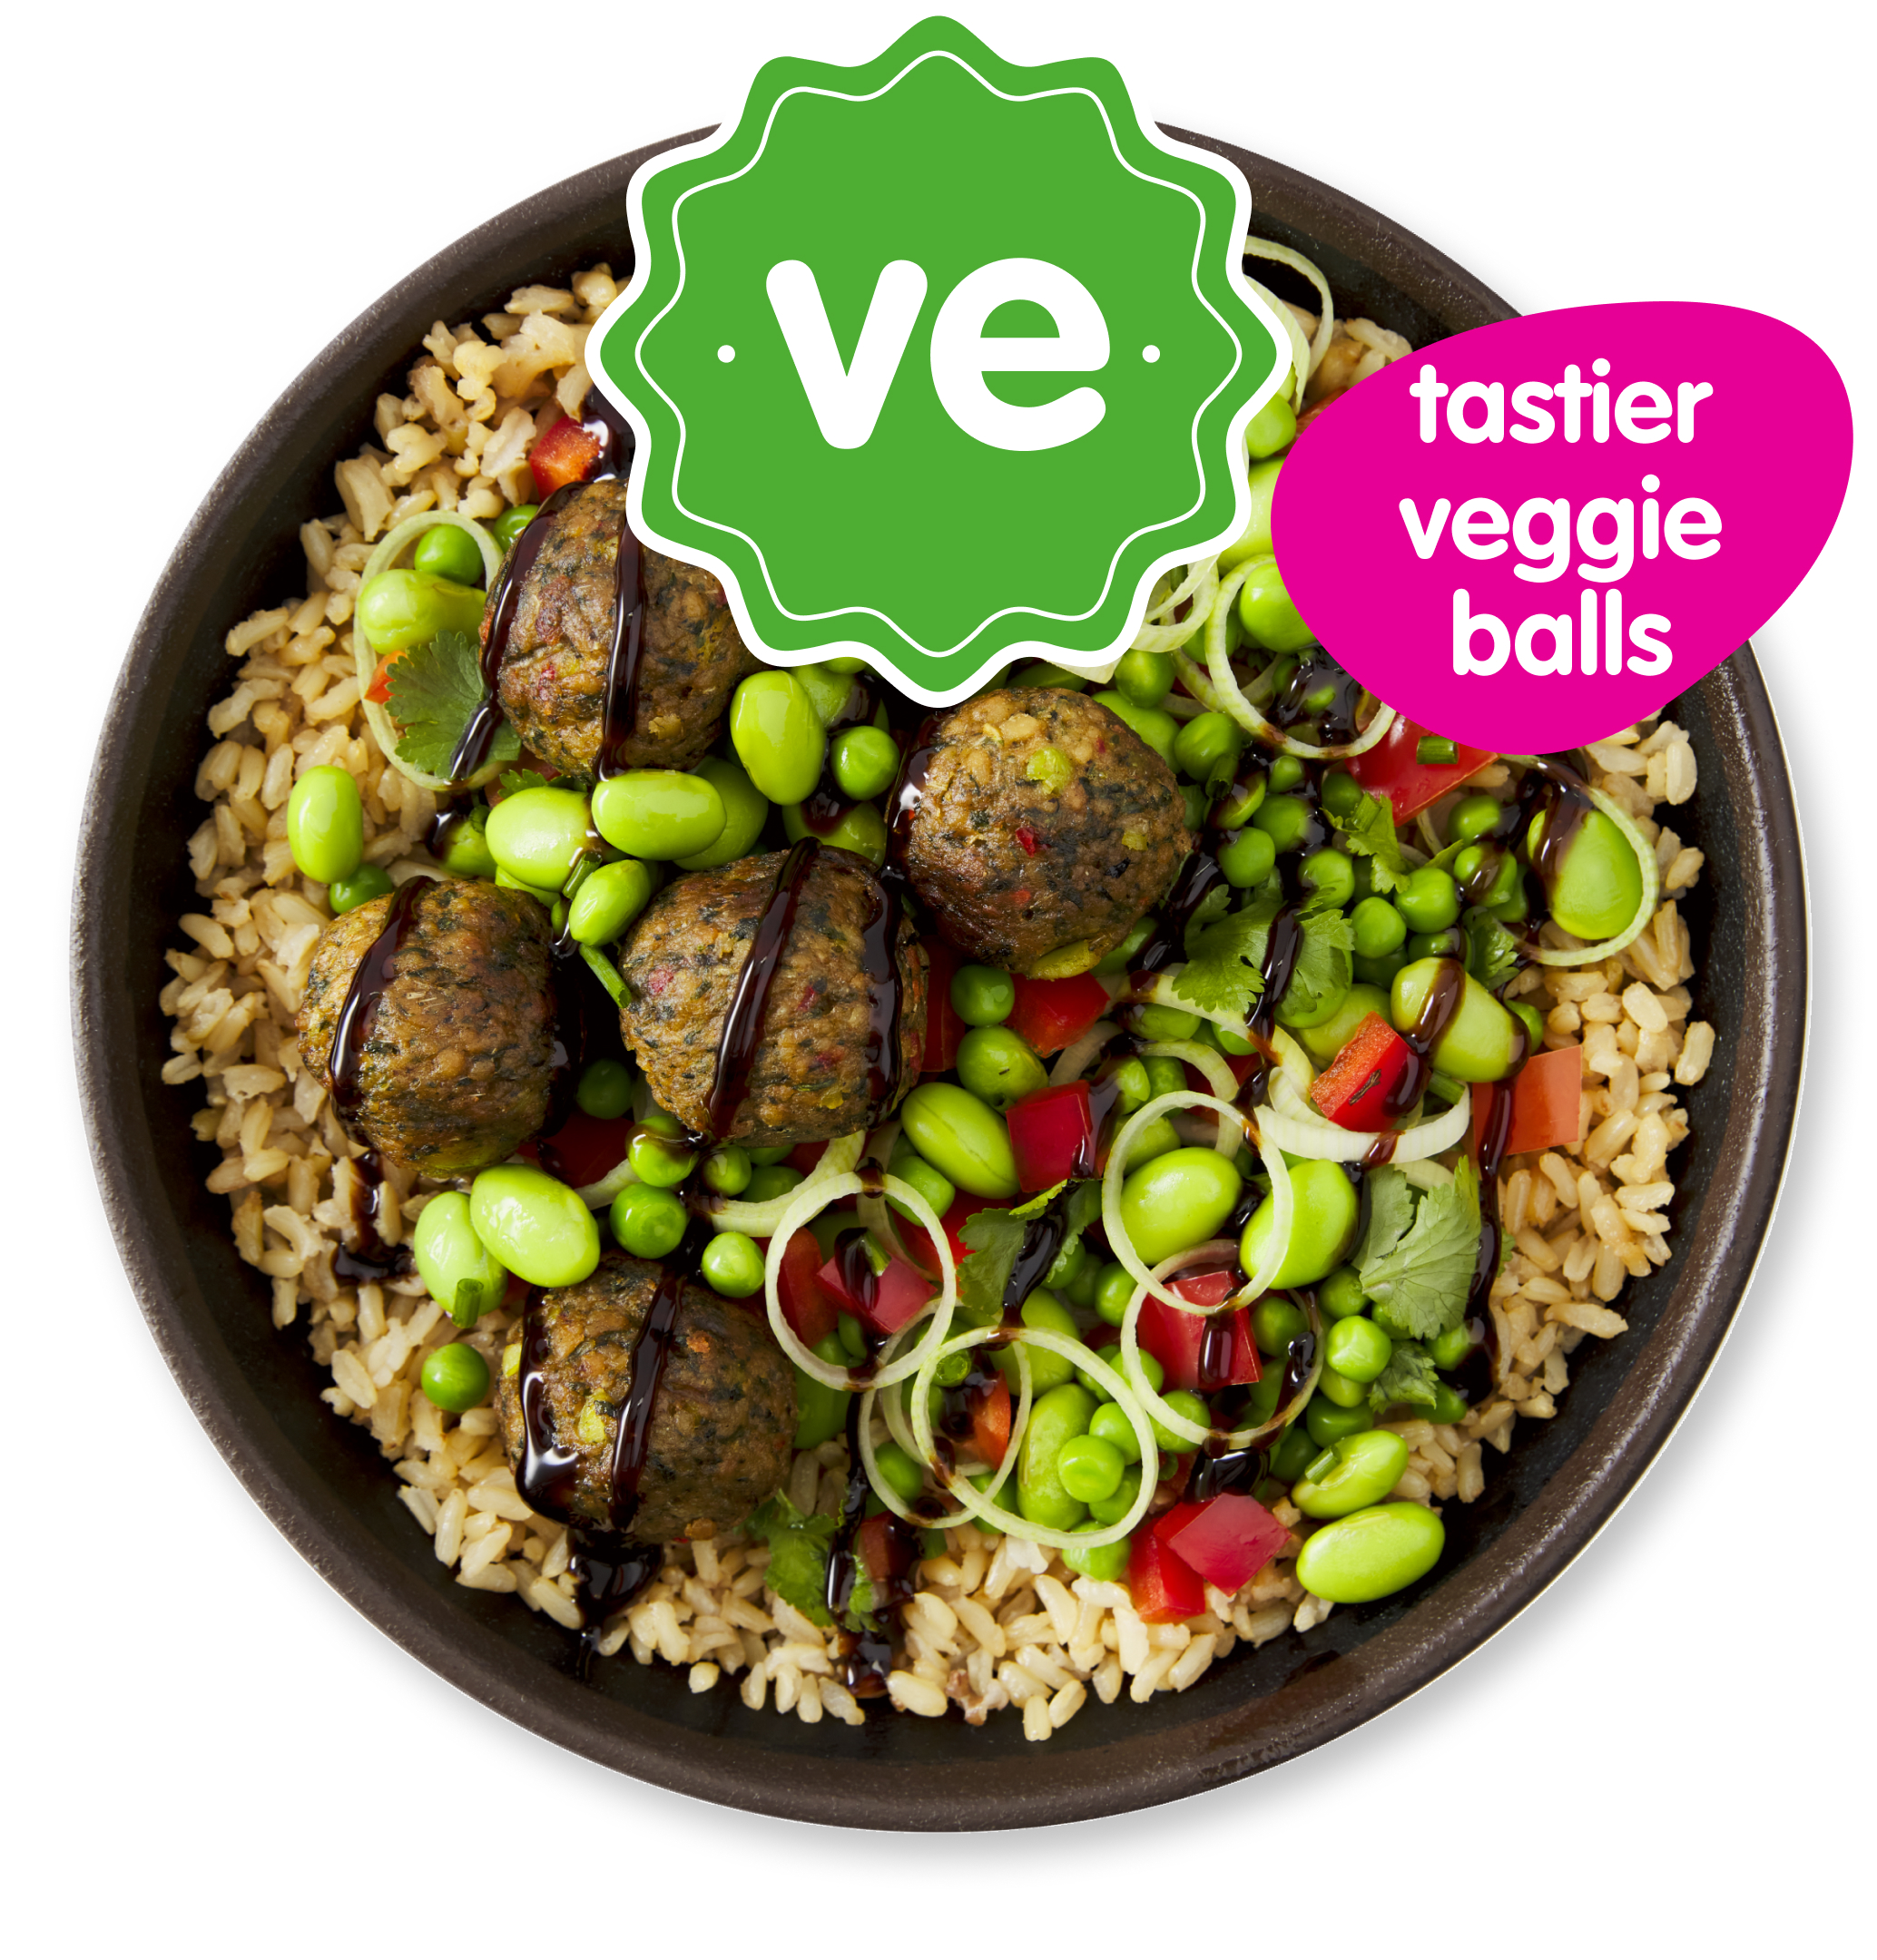 veggie'balls teriyaki veggie'balls teriyaki | itsu | 79 | 521 | 22.3 | 20.5 | 18.8 | 2.8 | Salt high |
| 5 | 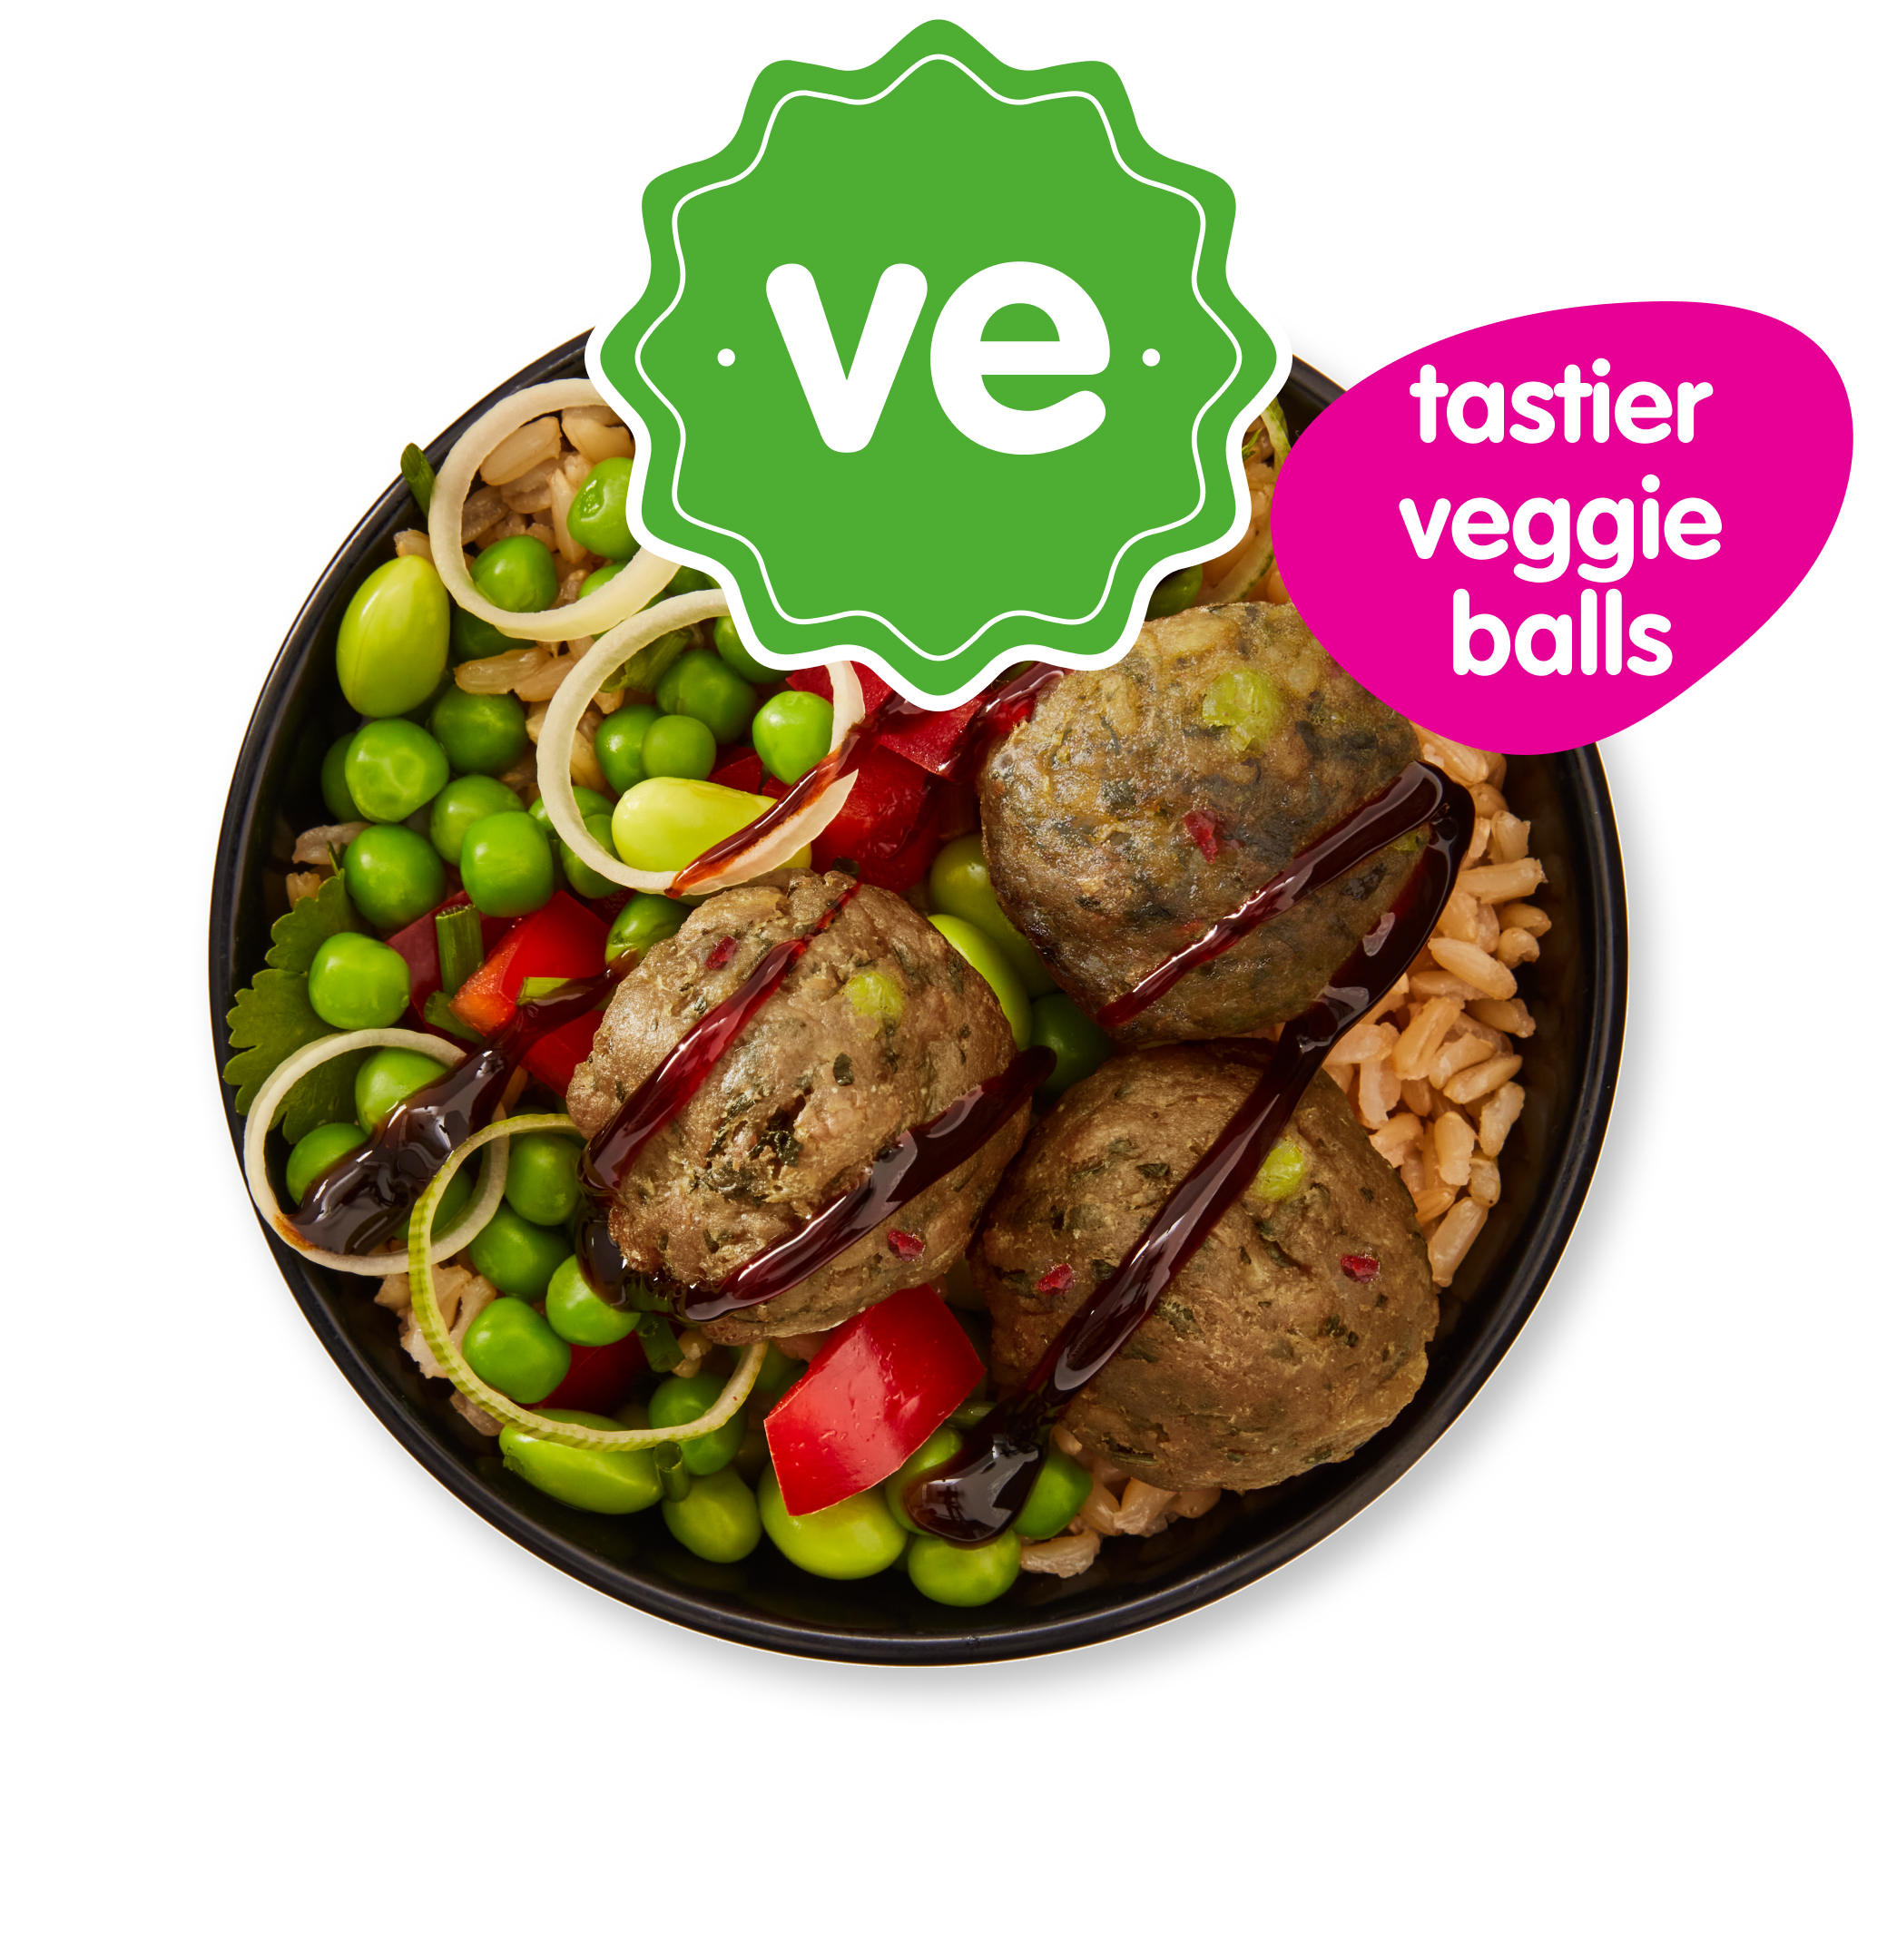 little veggie'balls teriyaki little veggie'balls teriyaki | itsu | 73 | 294 | 7.9 | 10.3 | 8.7 | 2.3 | Salt high |
| 6 | 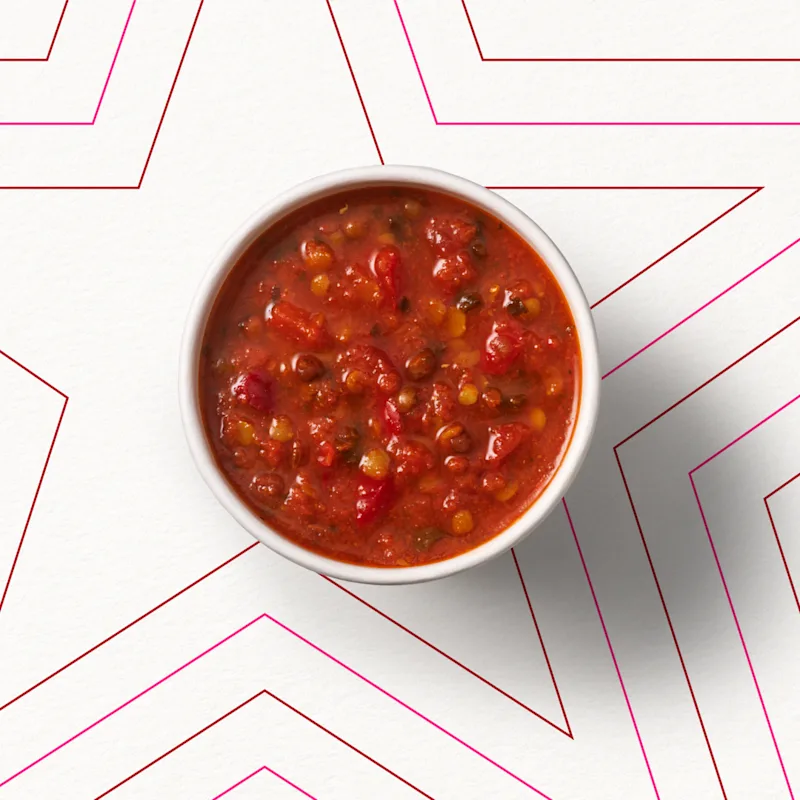 Rich Garam Masala Lentil Soup Rich Garam Masala Lentil Soup | pret | 71 | 209 | 8.8 | 7.3 | 13.9 | 2.1 | Salt high |
| 7 | 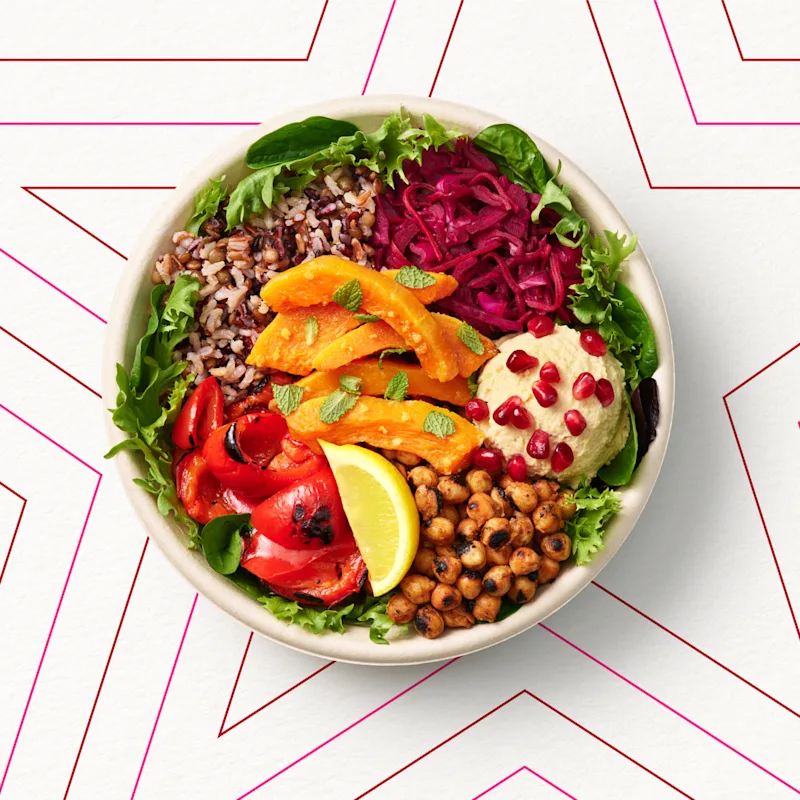 Butternut & Humous Mezze Bowl Butternut & Humous Mezze Bowl | pret | 84 | 379 | 12.7 | 12.7 | 11.7 | 1.4 | - |
| 8 | 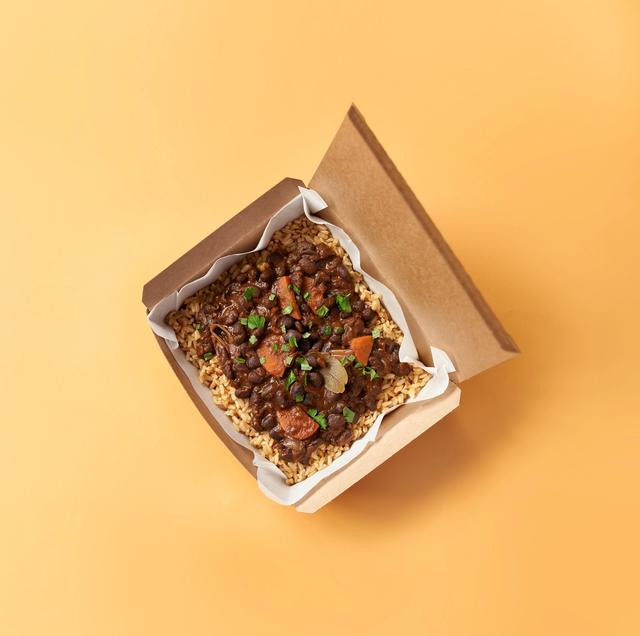 Brazilian Black Beans Small Brazilian Black Beans Small | LEON | 85 | 547 | 17.0 | 17.0 | 4.1 | 2.4 | Salt high |
| 9 | 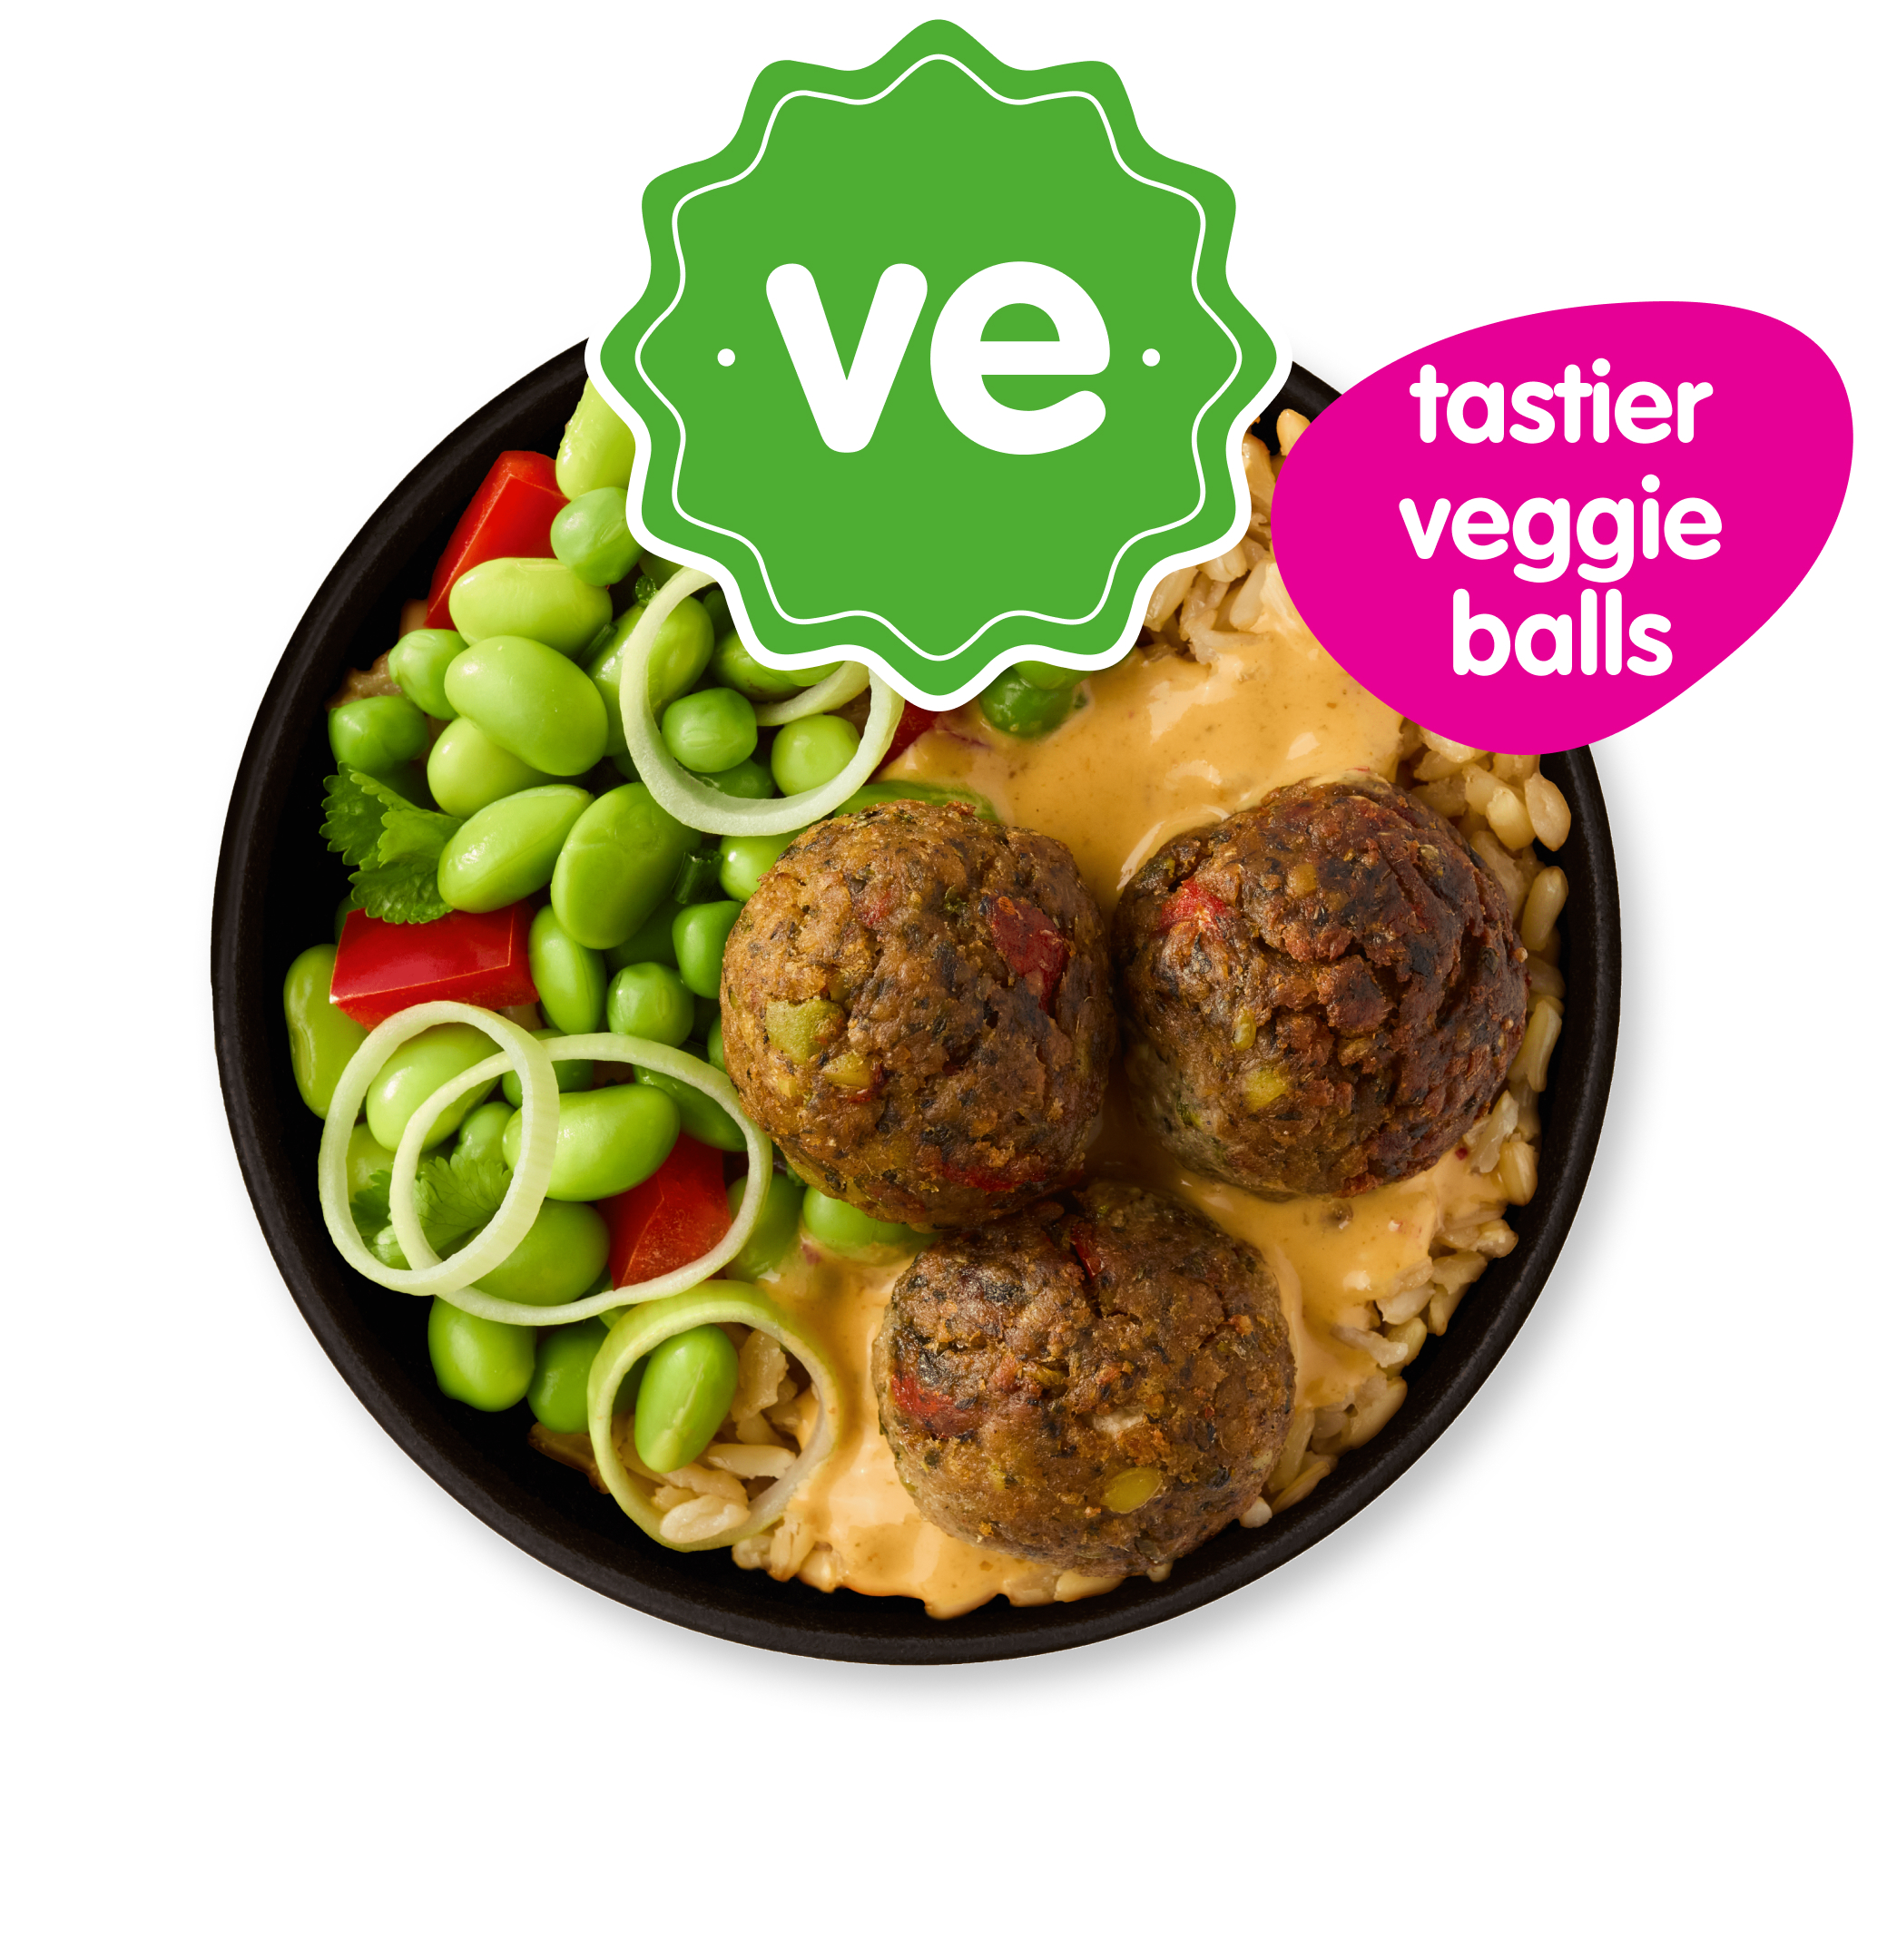 little Thai veggie'balls curry little Thai veggie'balls curry | itsu | 68 | 378 | 12.5 | 11.0 | 6.8 | 2.4 | Salt highSat fat high |
| 10 | 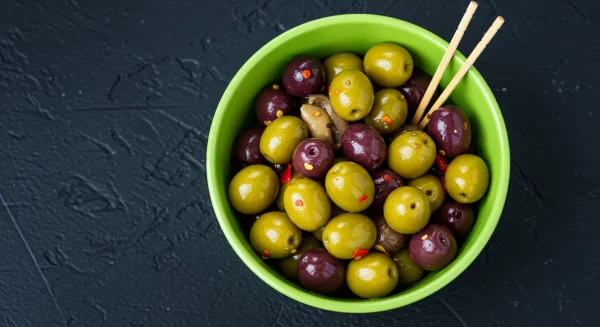 Spicy Mixed Olives Spicy Mixed Olives | Nandos | 49 | 138 | 1.2 | 3.9 | 0.0 | 4.6 | Salt high |
About this ranking
Only products published on Healthier Eats and included in core rankings are listed.
Methodology summary
The Healthier Score is a nutrition-based comparison score using published per-portion nutrition data.
Scores are combined using weighted averages. High levels of salt or saturated fat can cap the final score.
View full methodology →Watch-out key
- Salt highAbove 1.8g salt per serving
- Sat fat highAbove 5g saturated fat
- Fibre n/aFibre data not provided
- Score cappedScore reduced due to salt or sat fat
Brand breakdown
Number of top 10 appearances
- pret4
- itsu4
- LEON1
- Nandos1
Related insights
- More coming soon.
Important
The Healthier Score is not medical advice. It is a nutrition-based comparison score only. Always check the restaurant's latest nutrition, ingredients and allergen information before ordering.
Data caveats
Nutrition data is provided by restaurant brands and may change over time. Fibre is not always published. Where missing, a conservative fibre score is used.