
Satay Chicken Big Box
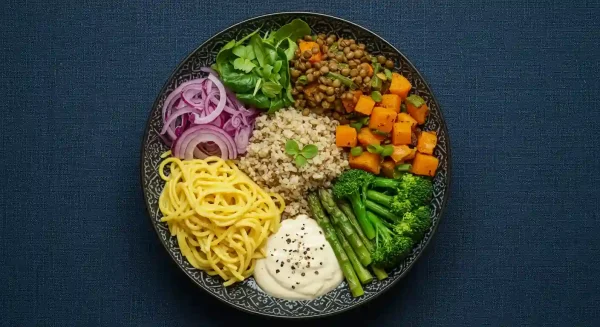
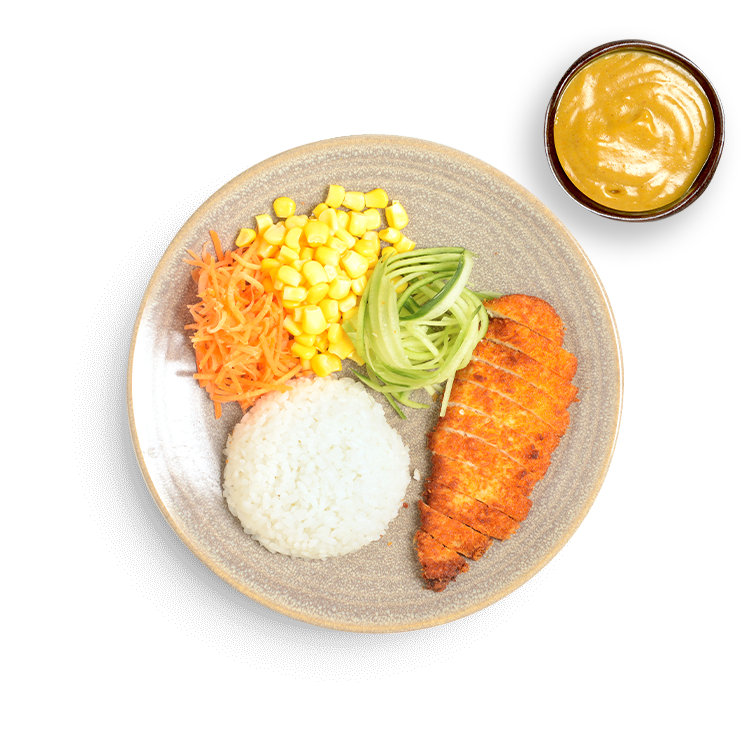
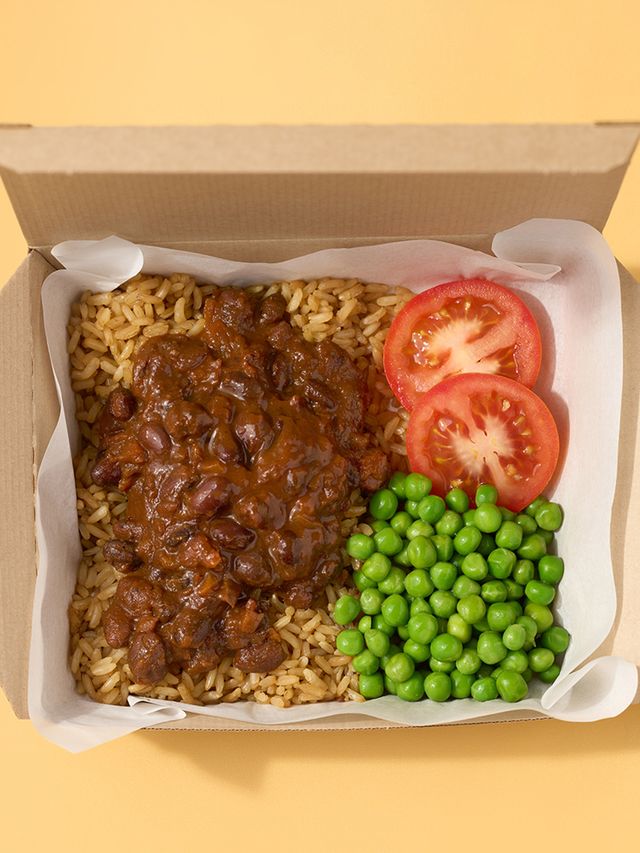
Marinated chicken thigh in the punchiest, peanutiest satay sauce. Served on brown rice with a gut-friendly mix of slaw, golden kraut, purple fermented carrot, fresh herbs, seven seed mix and a squeeze of lemon - layering in extra colour, crunch and plant-forward goodness.
Nutrition
| Calories | 812 kcal |
| Protein | 32g |
| Carbohydrates | 81g |
| Sugars | 9.5g |
| Fat | 40g |
| Saturated fat | 9.3g |
| Fibre | 6.1g |
| Salt | 3.3g |
Values shown per portion where available.
What's good about this meal
Watch-outs
Healthier Eats Score
The Healthier Score is a nutrition-based comparison score that ranks restaurant meals using published per-portion nutrition data: calories, protein, fibre, sugar, salt and saturated fat.
It does not assess ingredient quality, processing level, additives, cooking method, allergens or whether a meal is suitable for a specific diet.
Around 55% of the adult daily maximum. UK guidance says adults should have no more than 6g of salt per day. This product contains around 55% of that amount.
This meal contains 3.3g salt, around 55% of the adult daily maximum. This is above the UK high-salt per-portion threshold, but it does not reduce the final score because the raw score (60.1) is already at or below the salt cap of 75.
How this score is calculated
Each nutrient gets a 0-100 sub-score. Sub-scores are combined into a weighted average (the raw score). If a serving-level watch-out applies, the final score is capped.
Each nutrient value is mapped onto a scoring curve. Where a value sits between two anchor points, the score is interpolated linearly.
| 200kcal | → | 45 |
| 400kcal | → | 85 |
| 550kcal | → | 100 |
| 650kcal | → | 85 |
| 750kcal | → | 60 |
| 900kcal | → | 30 |
| 1100kcal | → | 10 |
812 kcal sits between 750 kcal and 900 kcal. The score is interpolated between 60 and 30, giving a calorie sub-score of 47.6.
Protein is scored using both total grams and the share of calories from protein. The gram score contributes 60% and the protein-energy score contributes 40%.
| 0g | → | 0 |
| 15g | → | 60 |
| 30g | → | 100 |
| 0g | → | 10 |
| 2g | → | 35 |
| 4g | → | 60 |
| 6g | → | 85 |
| 8g | → | 100 |
6.1g sits between 6g and 8g. The score is interpolated between 85 and 100, giving a fibre sub-score of 85.8.
| 5g | → | 100 |
| 10g | → | 80 |
| 15g | → | 55 |
| 25g | → | 25 |
| 50g | → | 0 |
Lower sugar scores better. 9.5g sits between 5g and 10g. The score is interpolated between 100 and 80, giving a sugar sub-score of 82.
| 1.5g | → | 100 |
| 2g | → | 80 |
| 2.4g | → | 60 |
| 3g | → | 40 |
| 4g | → | 15 |
| 6g | → | 0 |
Lower salt scores better. 3.3g sits between 3g and 4g. The score is interpolated between 40 and 15, giving a salt sub-score of 32.5.
Salt caps are separate from the salt sub-score. The sub-score contributes to the weighted average. A cap only limits the final score if salt is high enough and the raw score is above the cap.
| 3g | → | 100 |
| 5g | → | 75 |
| 7g | → | 40 |
| 10g | → | 15 |
| 20g | → | 0 |
Lower saturated fat scores better. 9.3g sits between 7g and 10g. The score is interpolated between 40 and 15, giving a saturated fat sub-score of 20.8.
- Calories: 812 kcal → between 750 and 900 kcal → 47.6/100
- Protein: 32g → blended grams + energy → 91.5/100
- Fibre: 6.1g → between 6 and 8g → 85.8/100
- Sugar: 9.5g → between 5 and 10g → 82/100
- Salt: 3.3g → between 3 and 4g → 32.5/100
- Saturated fat: 9.3g → between 7 and 10g → 20.8/100
Contribution = Sub-score x Weight. The raw score is the total contribution divided by the total weight (95).
| Nutrient | Sub-score | Weight | Contribution |
|---|---|---|---|
| Calories | 47.6 | 15 | 714.0 |
| Protein | 91.5 | 20 | 1,830.0 |
| Fibre | 85.8 | 15 | 1,287.0 |
| Sugar | 82 | 12 | 984.0 |
| Salt | 32.5 | 18 | 585.0 |
| Saturated fat | 20.8 | 15 | 312.0 |
| Total | 95 | 5,712.0 |
Raw score = 5,712.0 / 95 = 60.1. After rounding, the final Healthier Score is 60/100.
UK adults are advised to have no more than 6g salt per day. UK front-of-pack guidance treats more than 1.8g salt per portion as high for food portions over 100g. Healthier Eats uses these serving-level thresholds to decide when salt should limit the maximum score.
This is a nutrition-based comparison score for ranking restaurant meals against similar products. It is not a medical rating, ingredient-quality score or dietary advice. Always verify nutrition, ingredients and allergens with the restaurant before ordering.
What this score does not include
The Healthier Score is based on published nutrition values only. It does not currently assess ingredient quality, processing level, additives, cooking method, allergens or personal dietary suitability.
For example, two meals may have similar nutrition scores but differ in ingredients, processing or cooking method. Always check the restaurant's latest nutrition, ingredients and allergen information before ordering.
Allergens and dietary notes
Allergen information is for comparison only. Always check the official restaurant source before ordering.