Insight Report
Top 10 Healthiest wagamama Meals
The top-scoring wagamama meals, ranked by the Healthier Eats nutrition score.
Filtered to wagamama and ranked by overall nutrition balance.
Top 10 ranked
| Rank | Product | Brand | Score /100 | Calories (kcal) | Protein (g) | Fibre (g) | Sugar (g) | Salt (g) | Watch-outs |
|---|---|---|---|---|---|---|---|---|---|
| 1 | 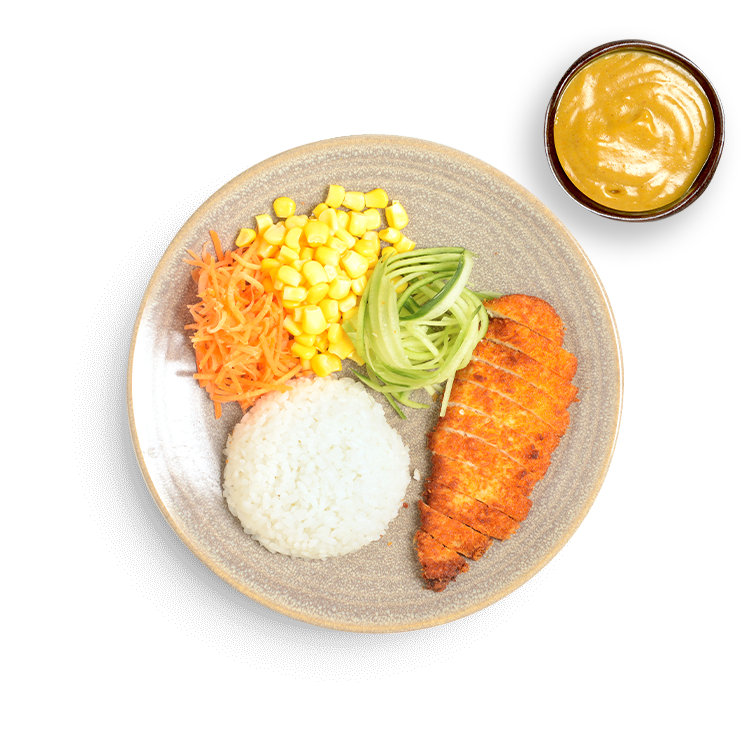 chicken katsu with katsu curry sauce chicken katsu with katsu curry sauce | wagamama | 90 | 426 | 21.8 | 4.5 | 5.0 | 0.6 | - |
| 2 | 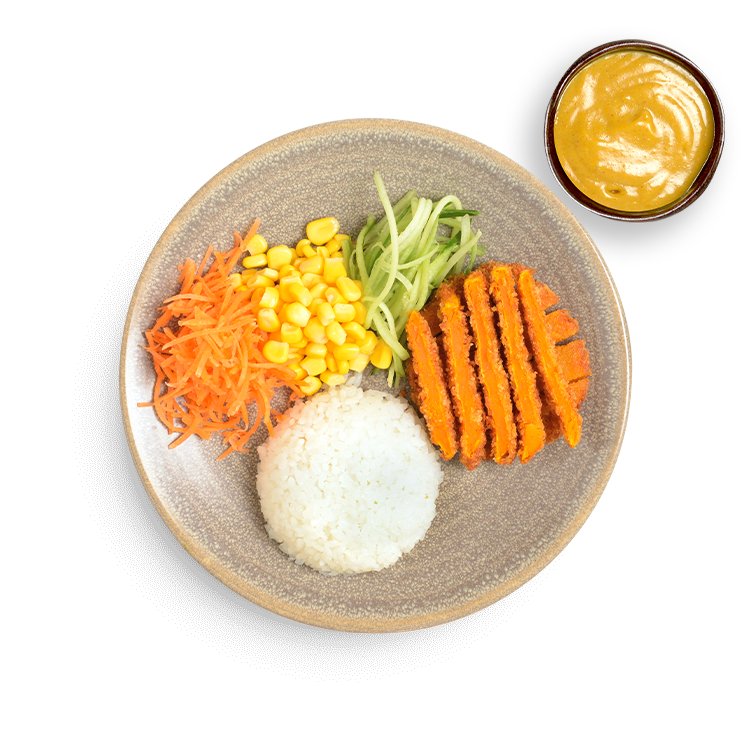 mini yasai katsu curry with katsu curry sauce mini yasai katsu curry with katsu curry sauce | wagamama | 84 | 548 | 10.9 | 5.9 | 7.8 | 0.6 | - |
| 3 | 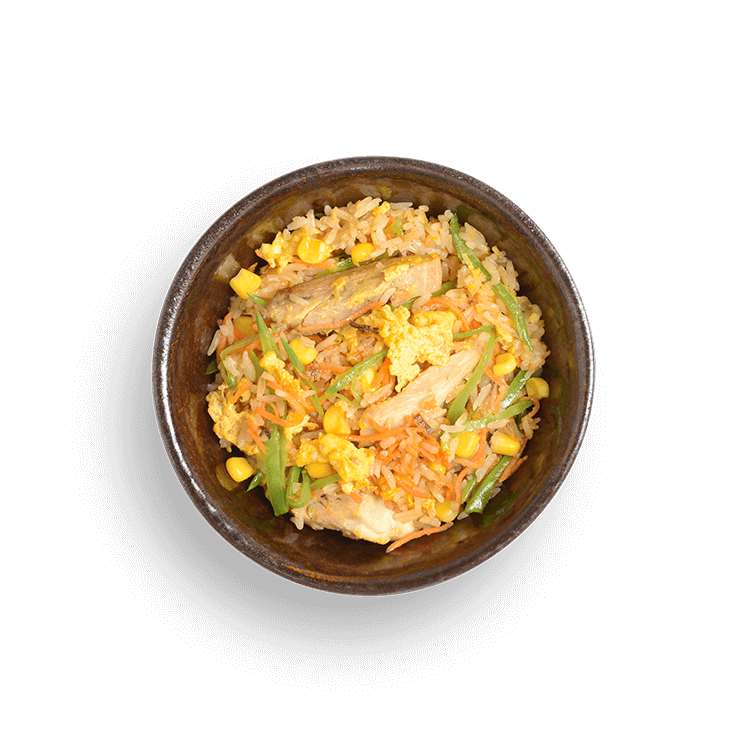 chicken cha han chicken cha han | wagamama | 83 | 405 | 19.2 | 2.8 | 9.8 | 1.0 | - |
| 4 | 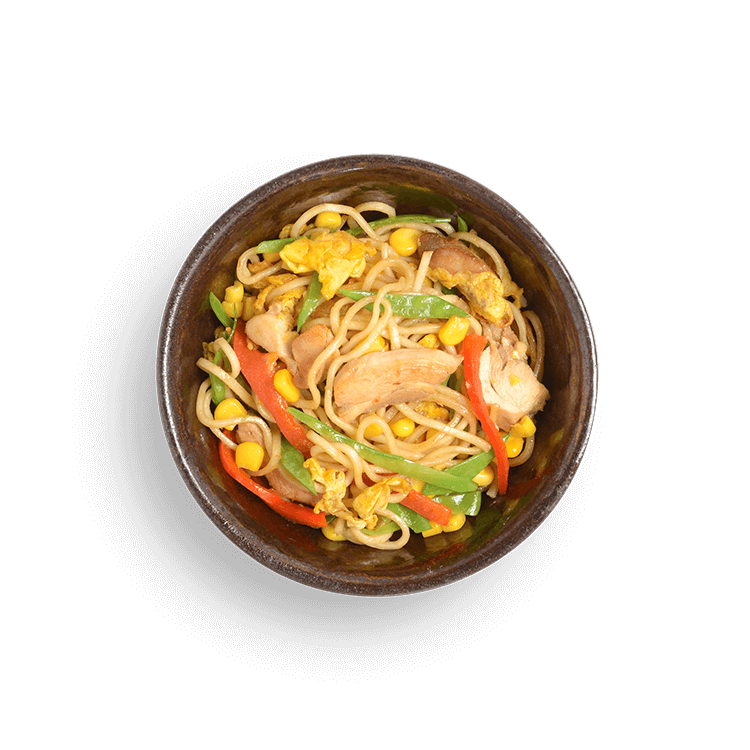 chicken yaki soba chicken yaki soba | wagamama | 82 | 413 | 20.9 | 2.1 | 9.9 | 1.5 | - |
| 5 | 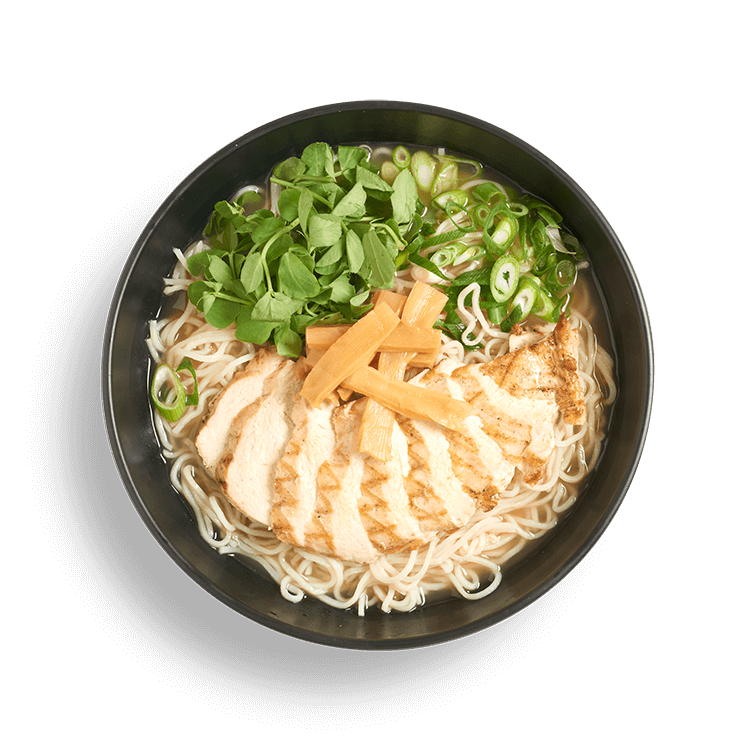 grilled chicken ramen grilled chicken ramen | wagamama | 81 | 529 | 34.5 | 2.1 | 3.1 | 2.5 | Salt high |
| 6 | 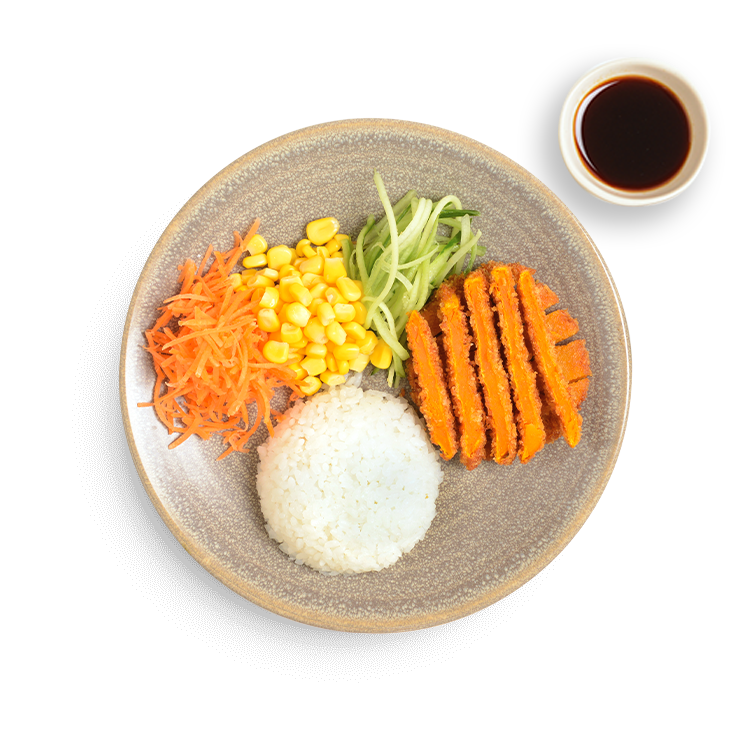 mini yasai katsu curry with amai sauce mini yasai katsu curry with amai sauce | wagamama | 79 | 524 | 10.6 | 5.4 | 14.2 | 0.9 | - |
| 7 | 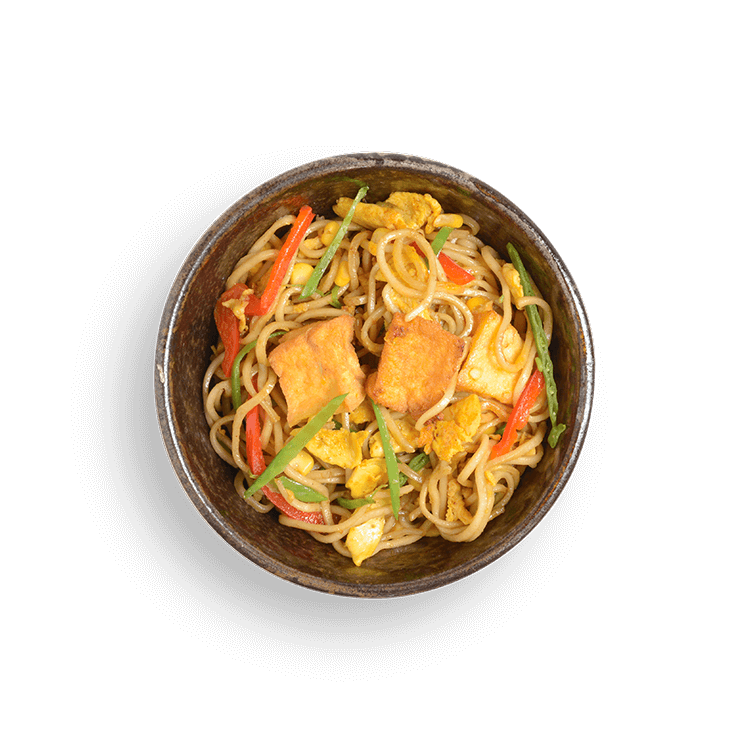 mini yasai yaki soba mini yasai yaki soba | wagamama | 78 | 409 | 15.6 | 2.0 | 10.0 | 1.4 | - |
| 8 | 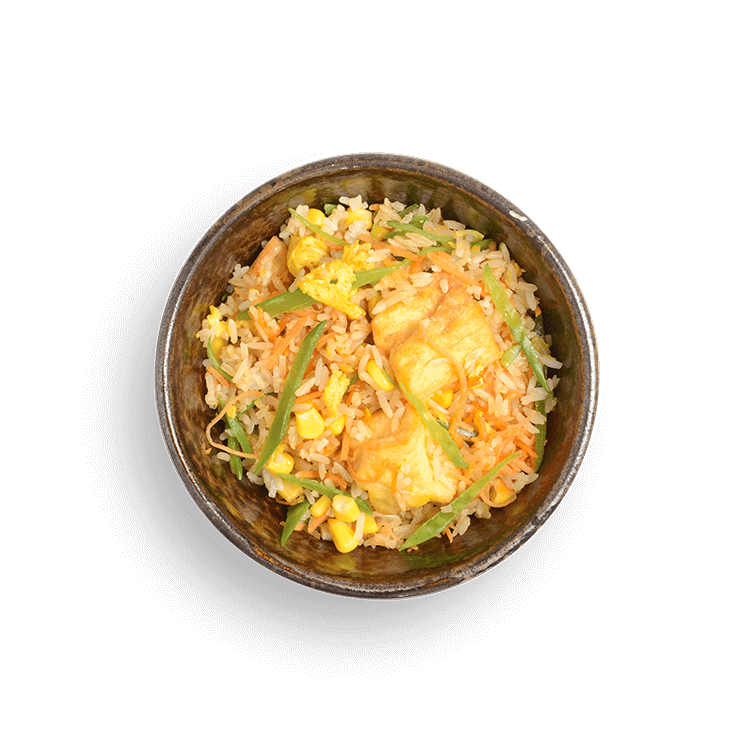 mini yasai cha han mini yasai cha han | wagamama | 78 | 402 | 14.0 | 2.7 | 10.0 | 0.9 | - |
| 9 |  yasai yaki soba | udon noodles yasai yaki soba | udon noodles | wagamama | 77 | 337 | 12.1 | 3.8 | 11.0 | 1.1 | - |
| 10 |  chicken + prawn yaki udon chicken + prawn yaki udon | wagamama | 75 | 728 | 40.3 | 9.9 | 8.7 | 3.3 | Salt highScore capped |
About this ranking
wagamama products only.
Methodology summary
The Healthier Score is a nutrition-based comparison score using published per-portion nutrition data.
Scores are combined using weighted averages. High levels of salt or saturated fat can cap the final score.
View full methodology →Watch-out key
- Salt highAbove 1.8g salt per serving
- Sat fat highAbove 5g saturated fat
- Fibre n/aFibre data not provided
- Score cappedScore reduced due to salt or sat fat
Brand breakdown
Number of top 10 appearances
- wagamama10
Related insights
- More coming soon.
Important
The Healthier Score is not medical advice. It is a nutrition-based comparison score only. Always check the restaurant's latest nutrition, ingredients and allergen information before ordering.
Data caveats
Nutrition data is provided by restaurant brands and may change over time. Fibre is not always published. Where missing, a conservative fibre score is used.