Insight Report
Top 10 Healthiest itsu Sushi
Ranked from our published nutrition database using the Healthier Score, which compares per-portion calories, protein, fibre, sugar, salt and saturated fat.
Top 10 ranked
| Rank | Product | Brand | Score /100 | Calories (kcal) | Protein (g) | Fibre (g) | Sugar (g) | Salt (g) | Watch-outs |
|---|---|---|---|---|---|---|---|---|---|
| 1 | 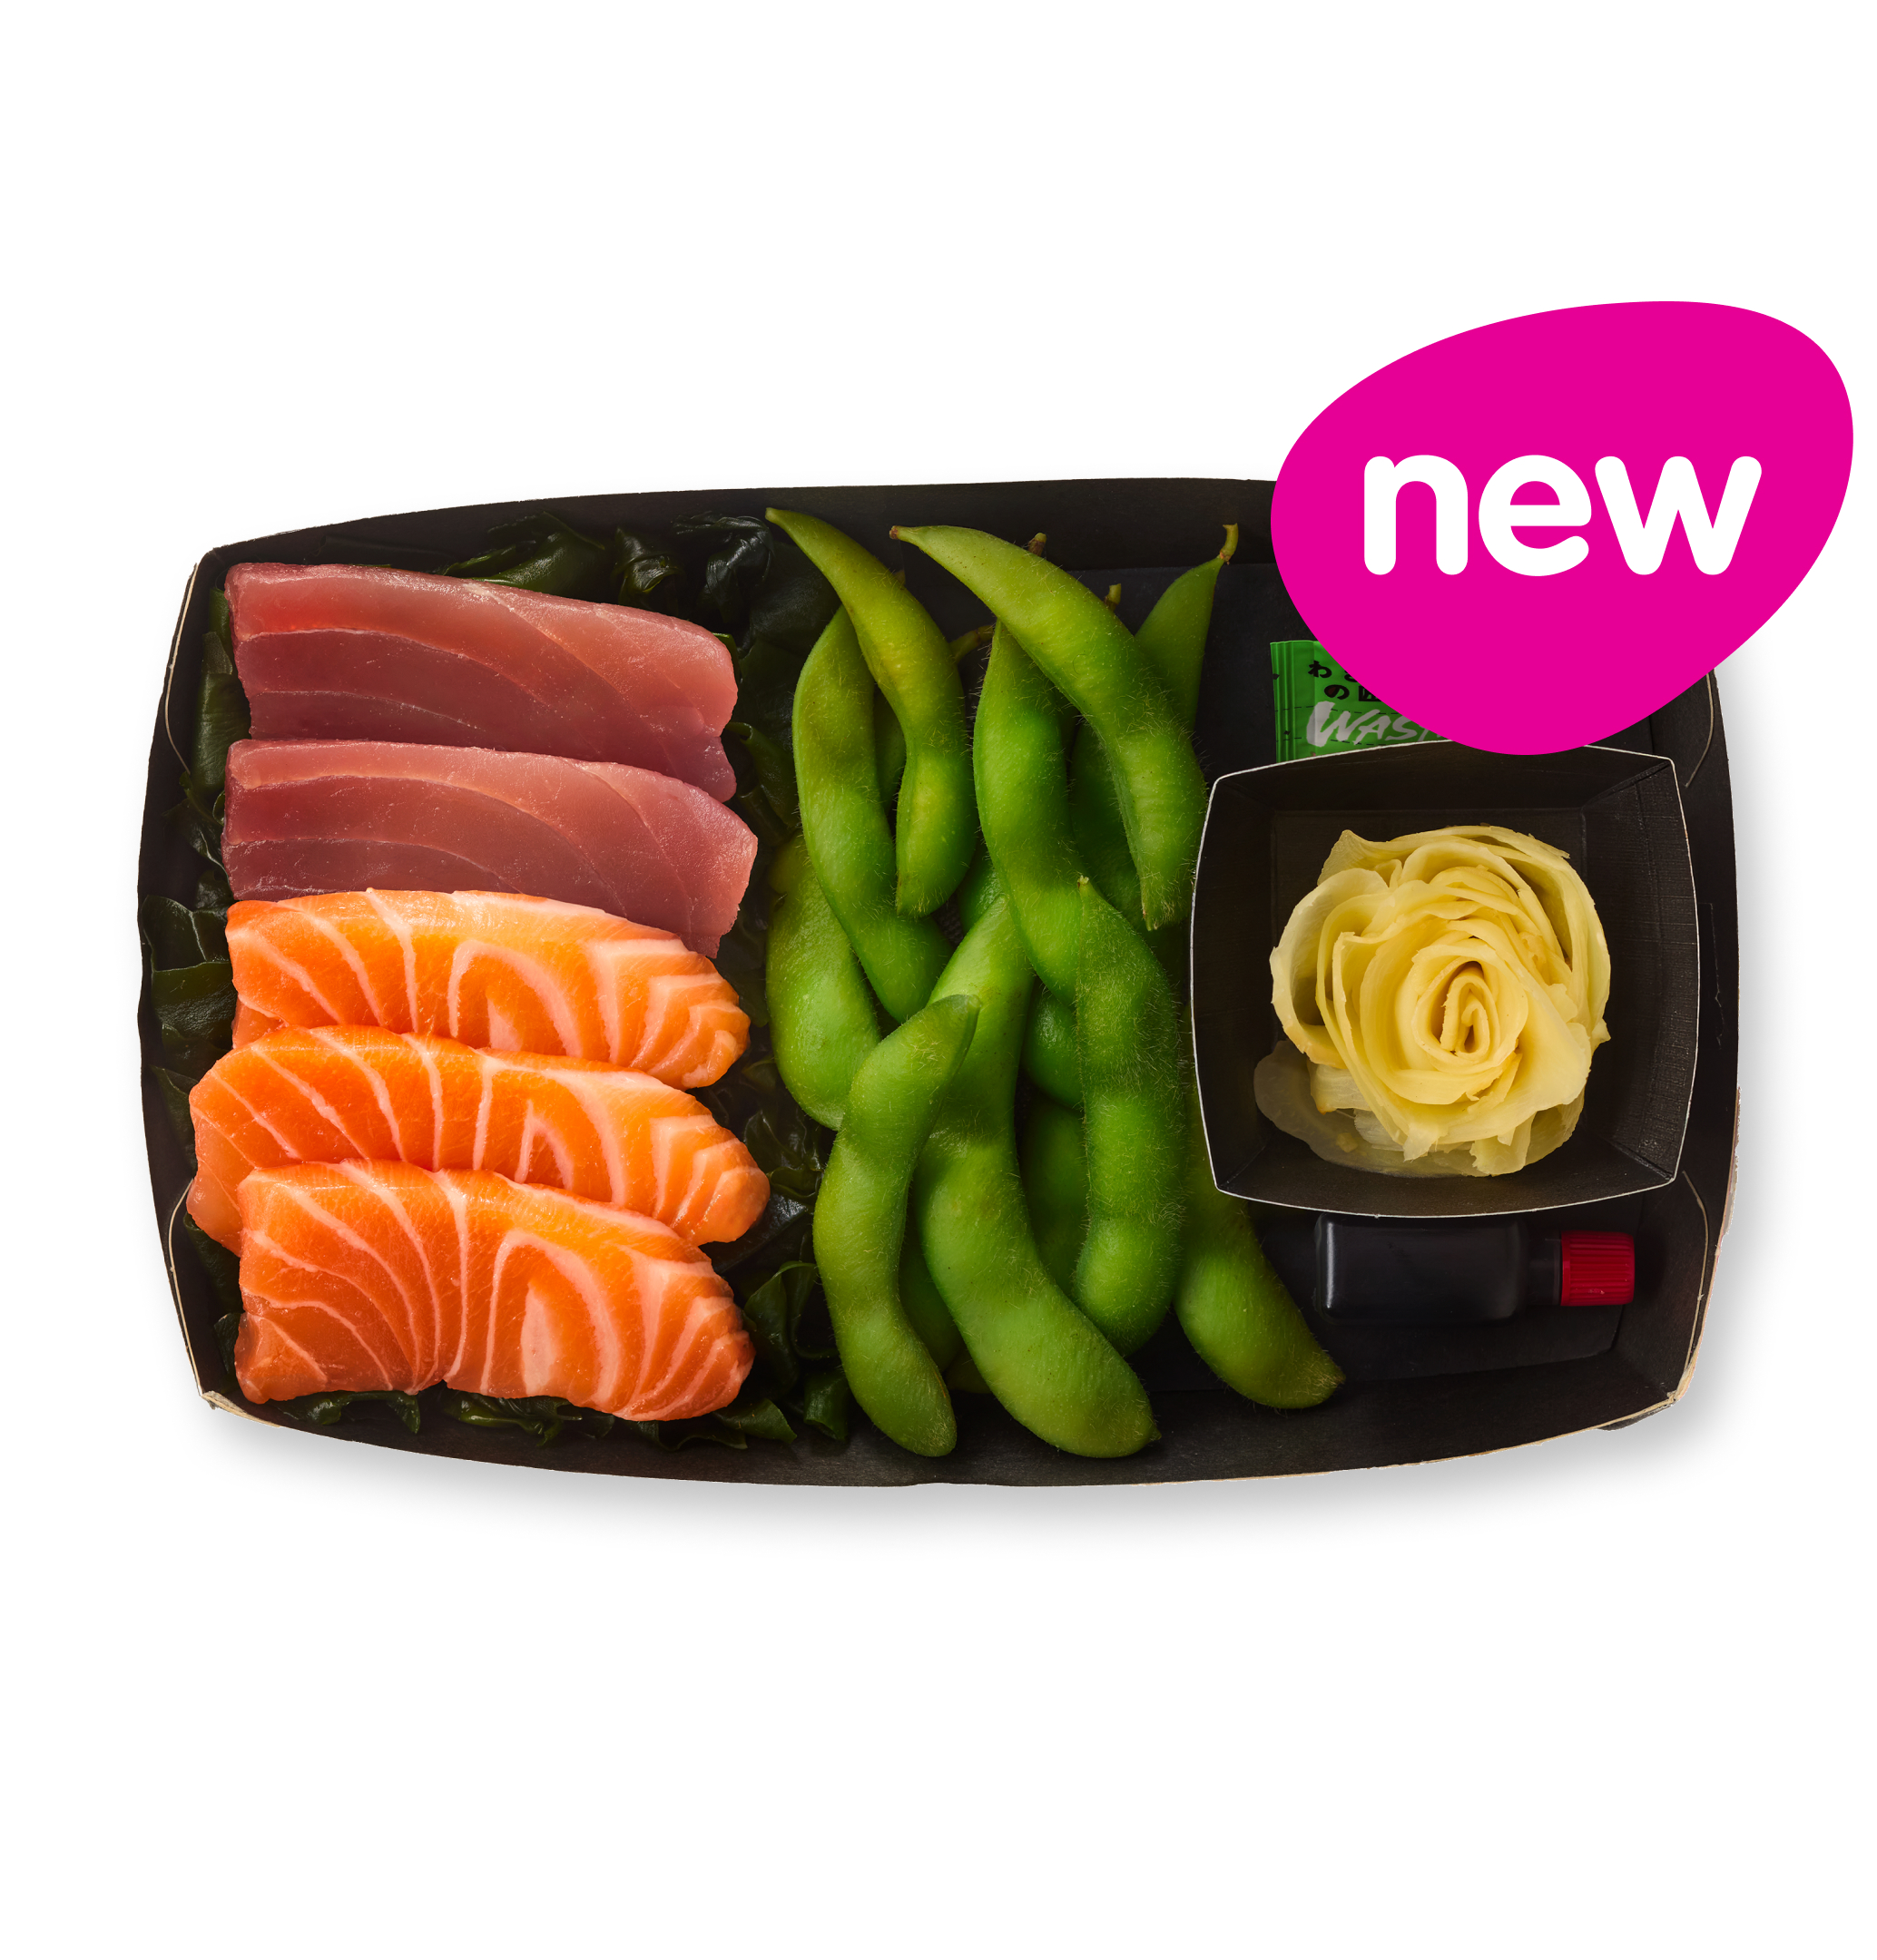 tuna & salmon sashimi midi tuna & salmon sashimi midi | itsu | 85 | 212 | 23.6 | 5.4 | 1.7 | 1.7 | - |
| 2 | 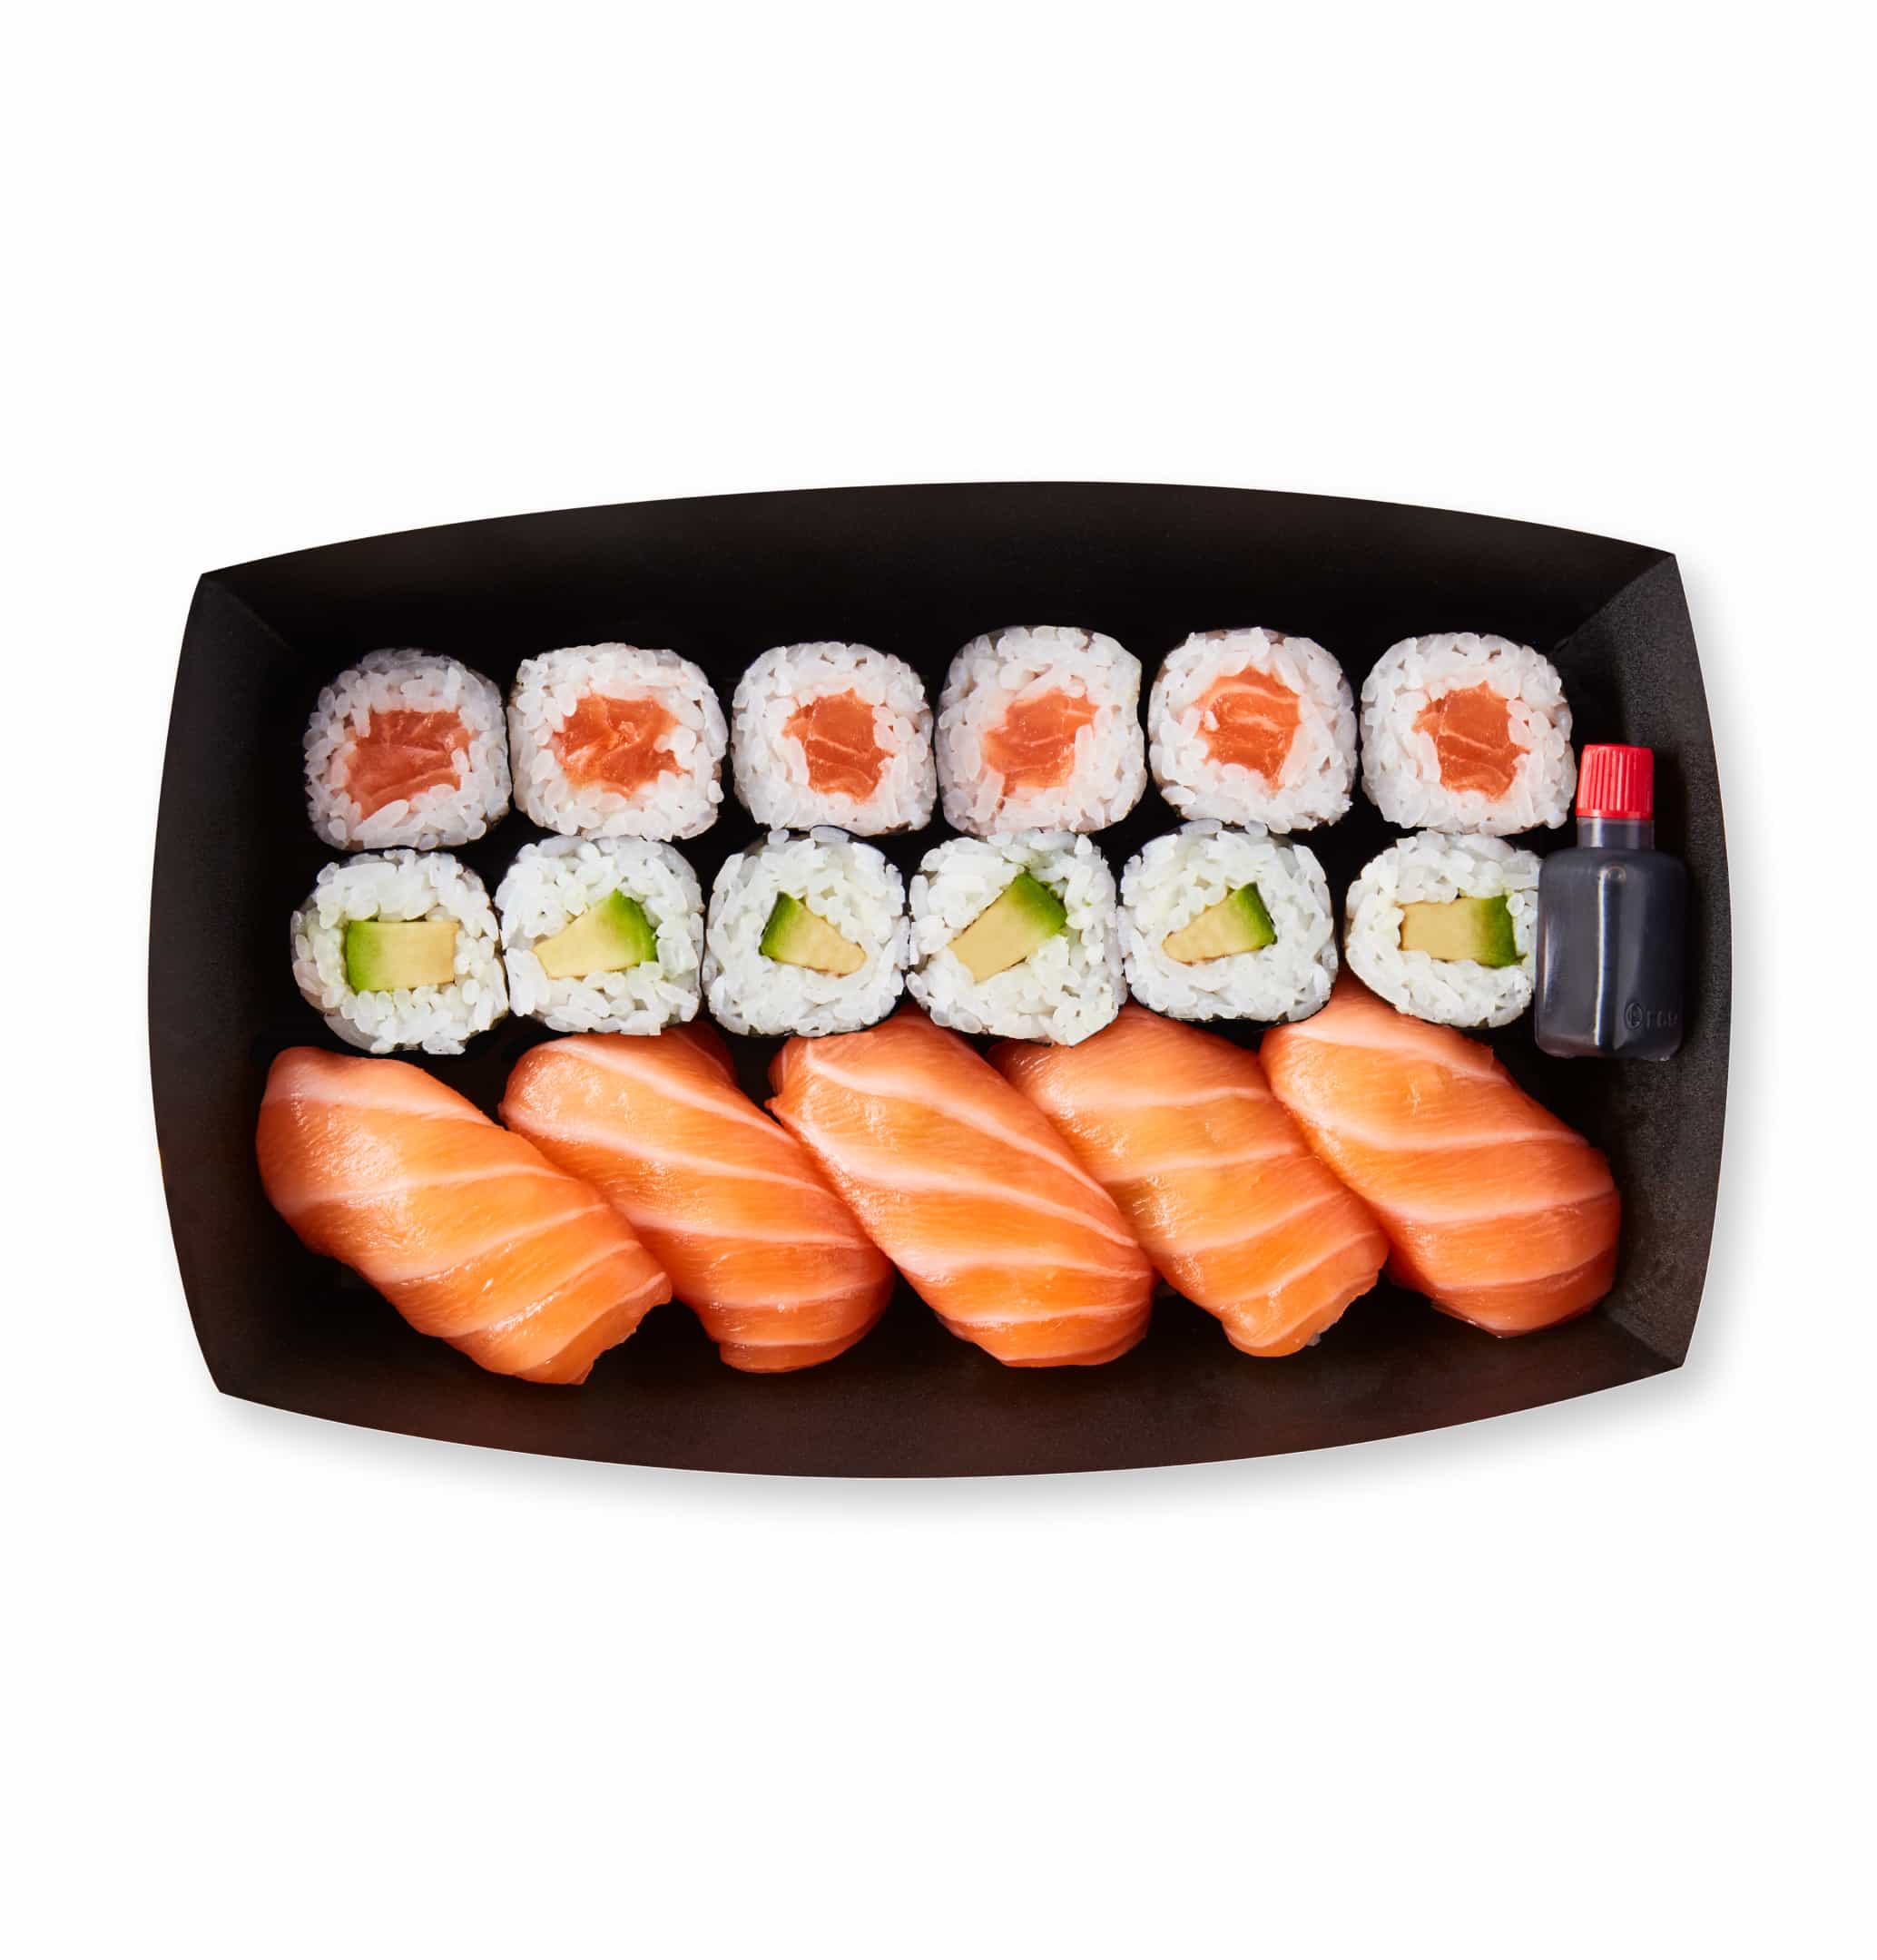 sushi festival sushi festival | itsu | 81 | 510 | 19.1 | 2.4 | 3.9 | 1.9 | Salt high |
| 3 | 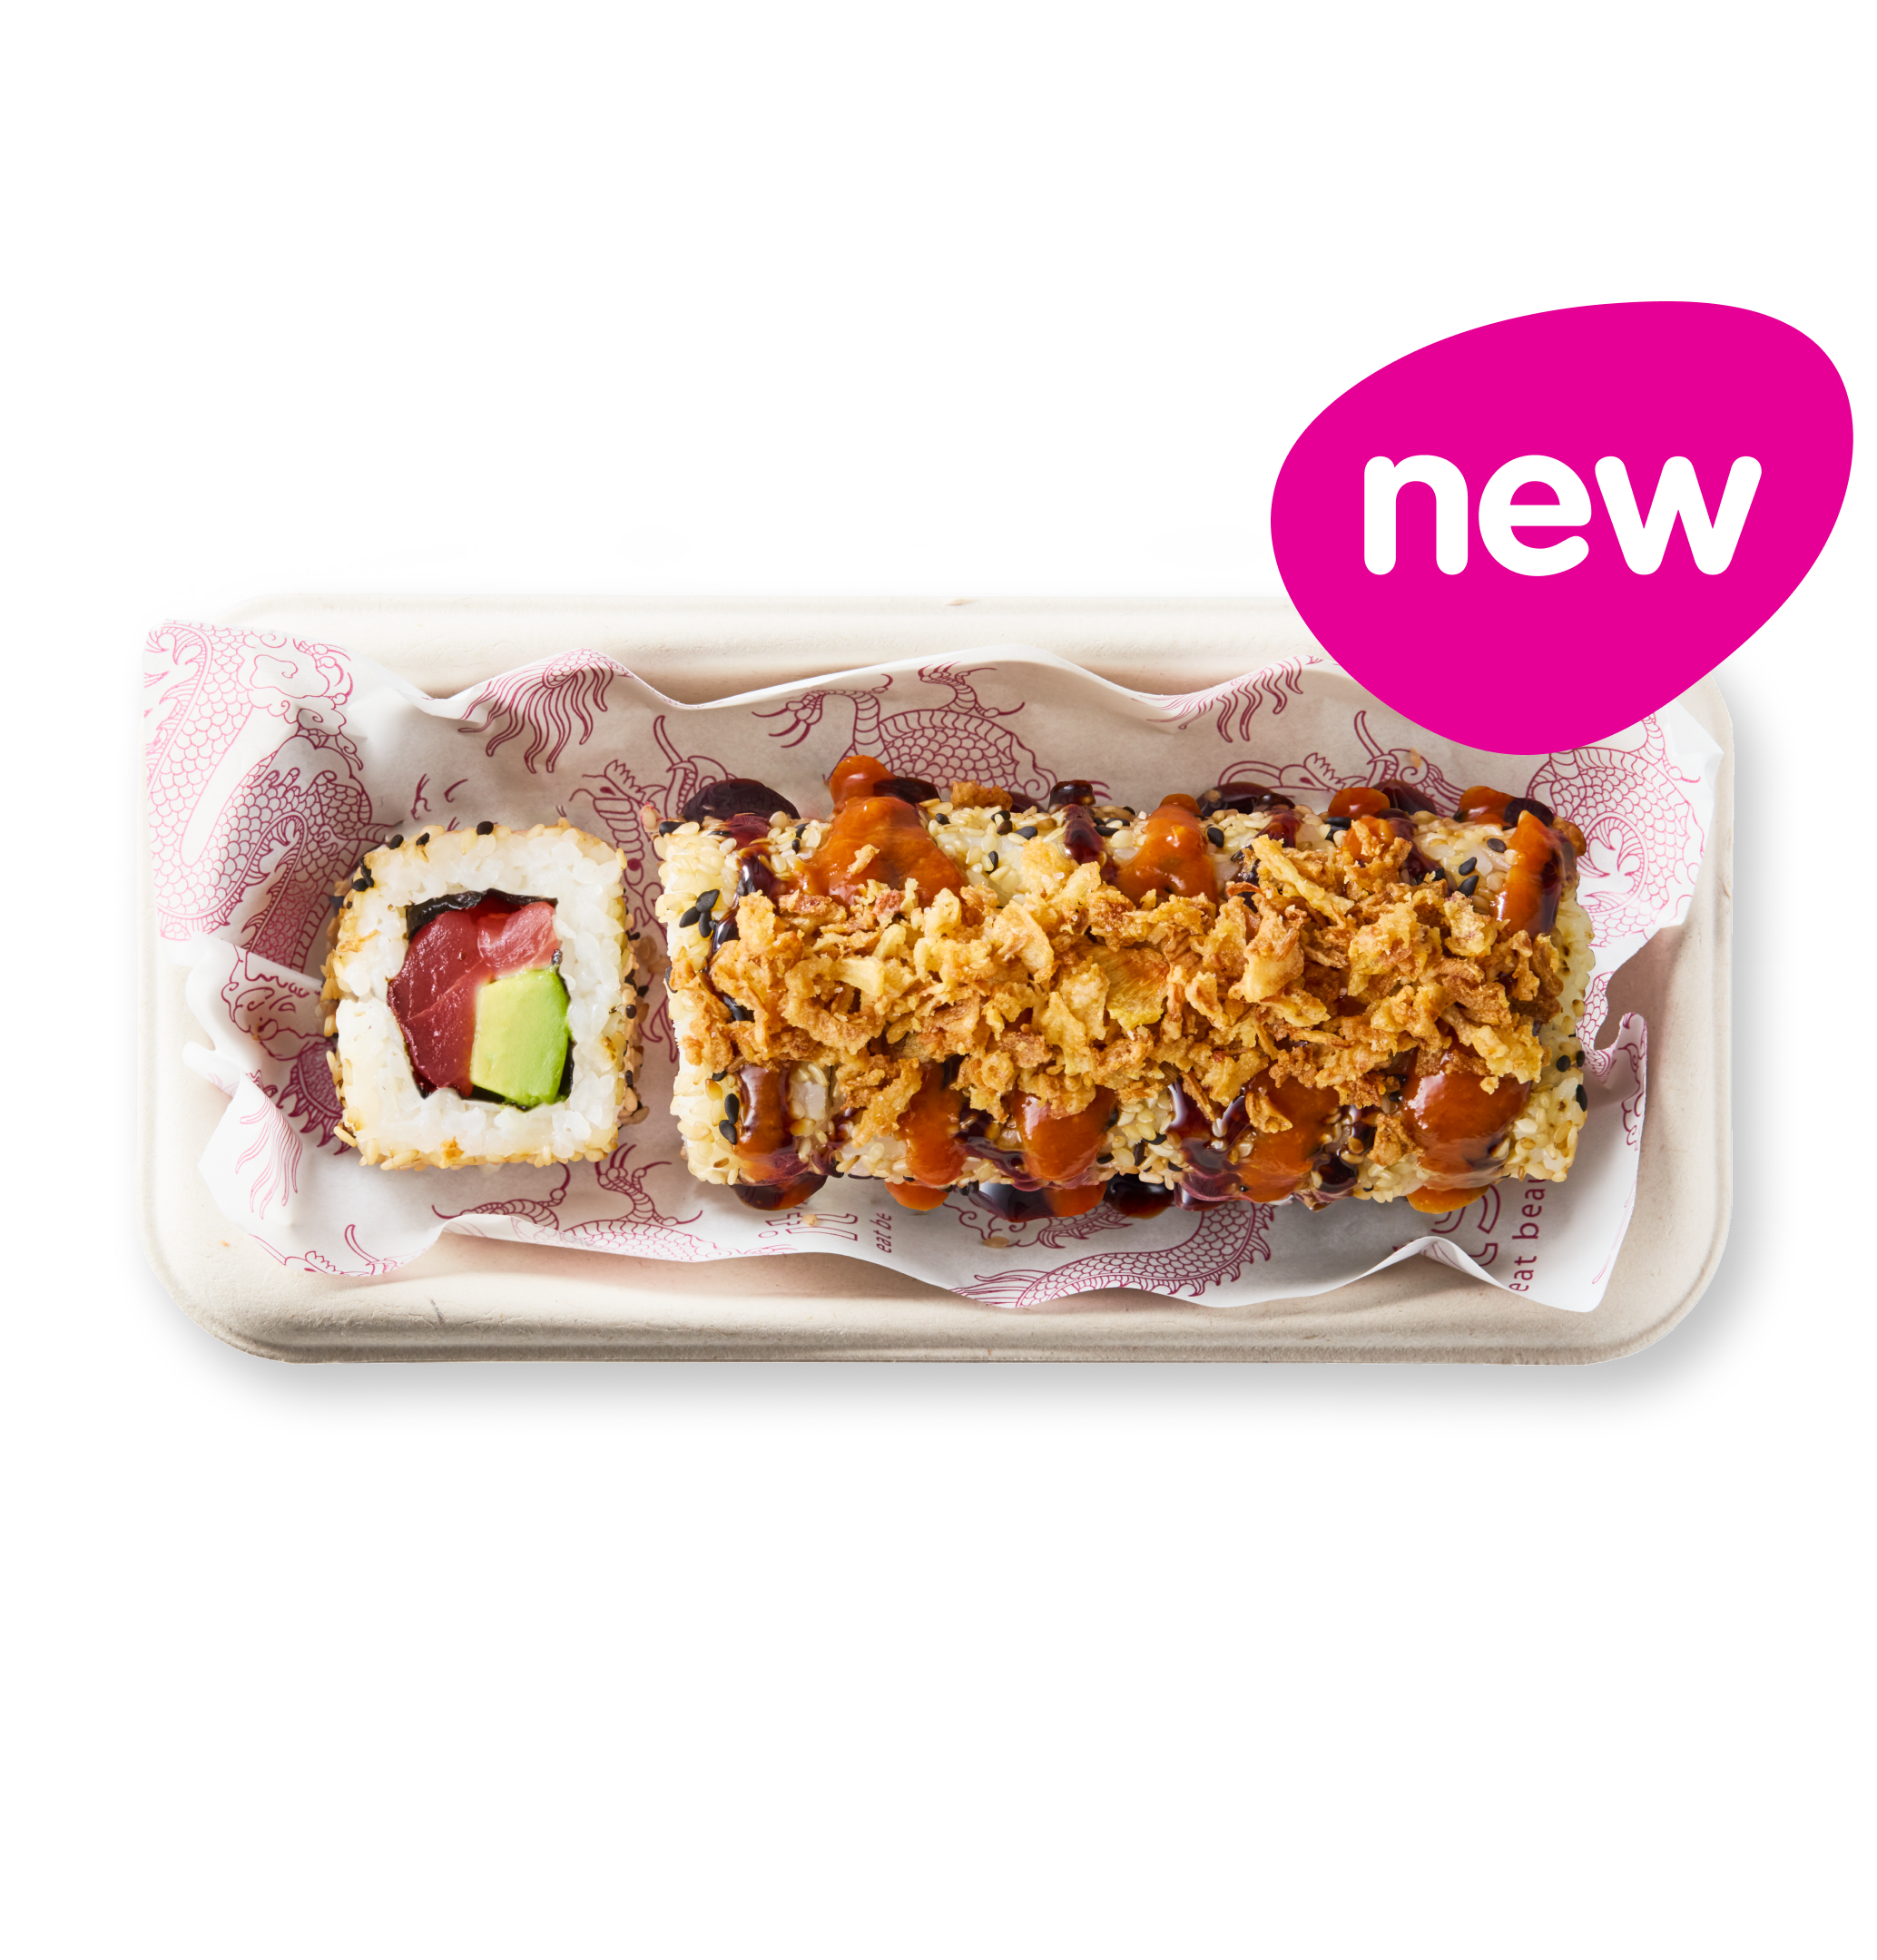 spicy tuna dragon rolls spicy tuna dragon rolls | itsu | 77 | 482 | 30.2 | 6.5 | 16.0 | 2.5 | Salt highSat fat high |
| 4 | 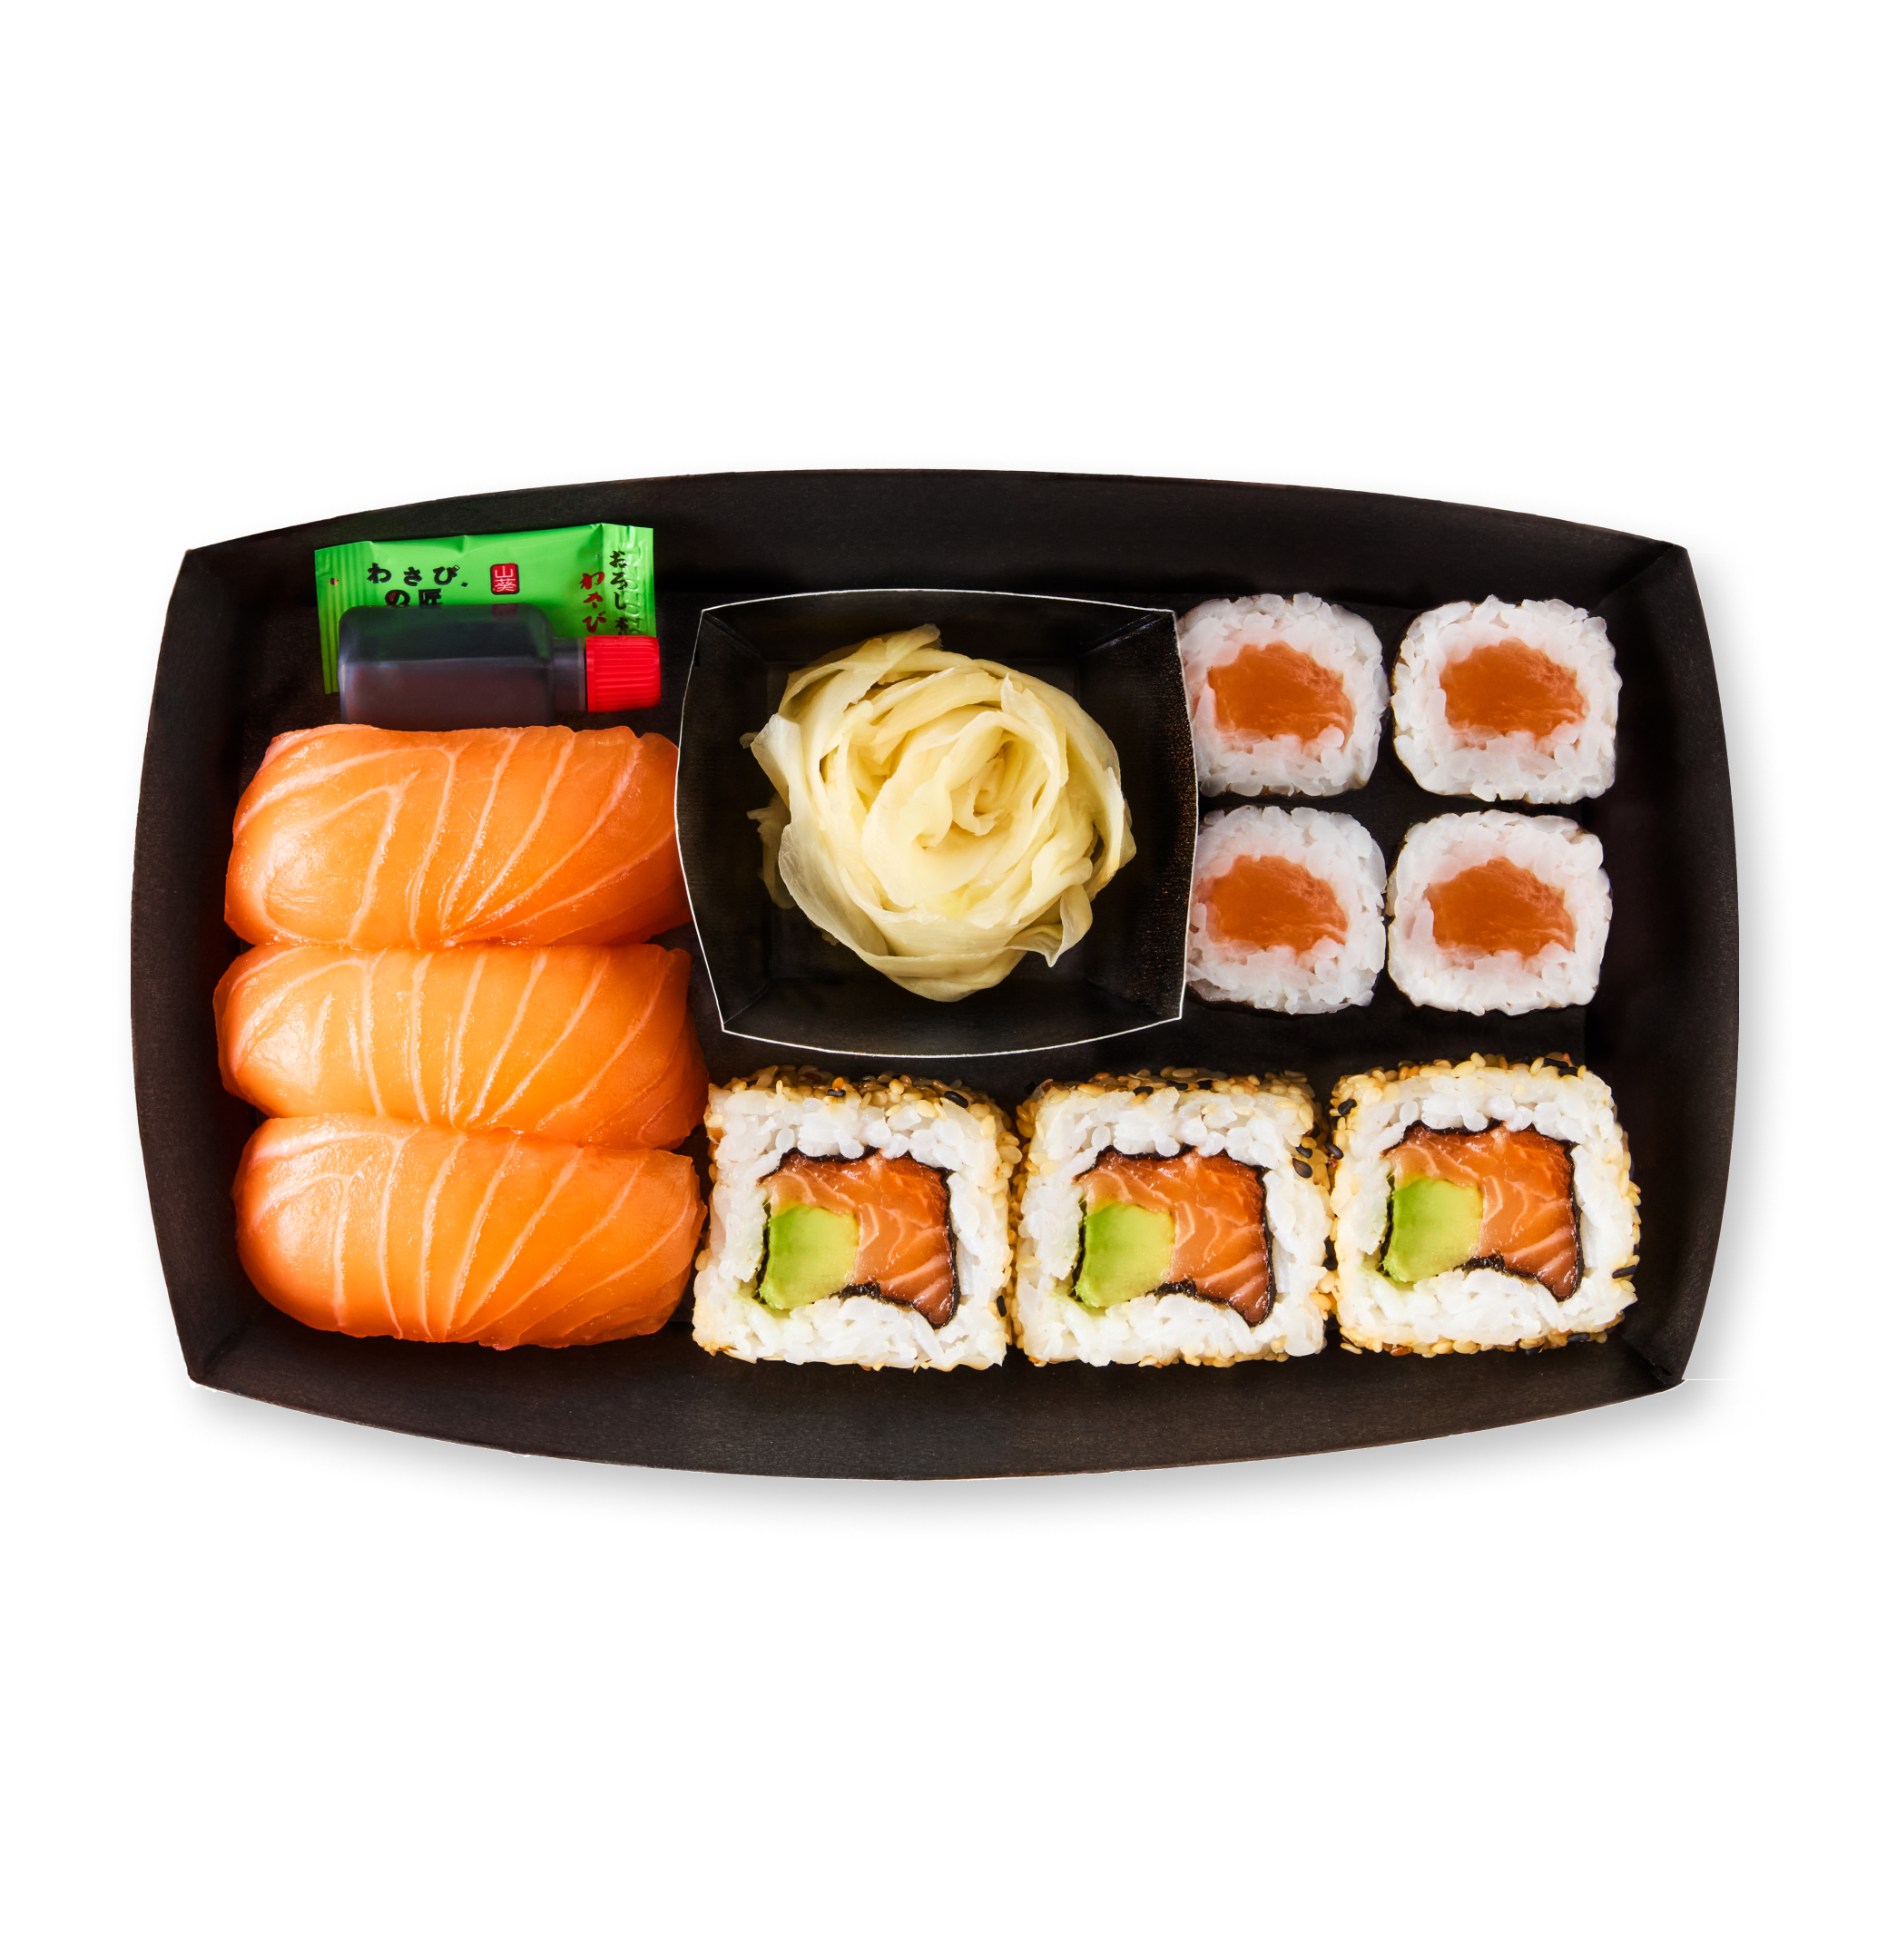 super salmon light super salmon light | itsu | 76 | 431 | 17.6 | 4.6 | 8.1 | 2.8 | Salt high |
| 5 | 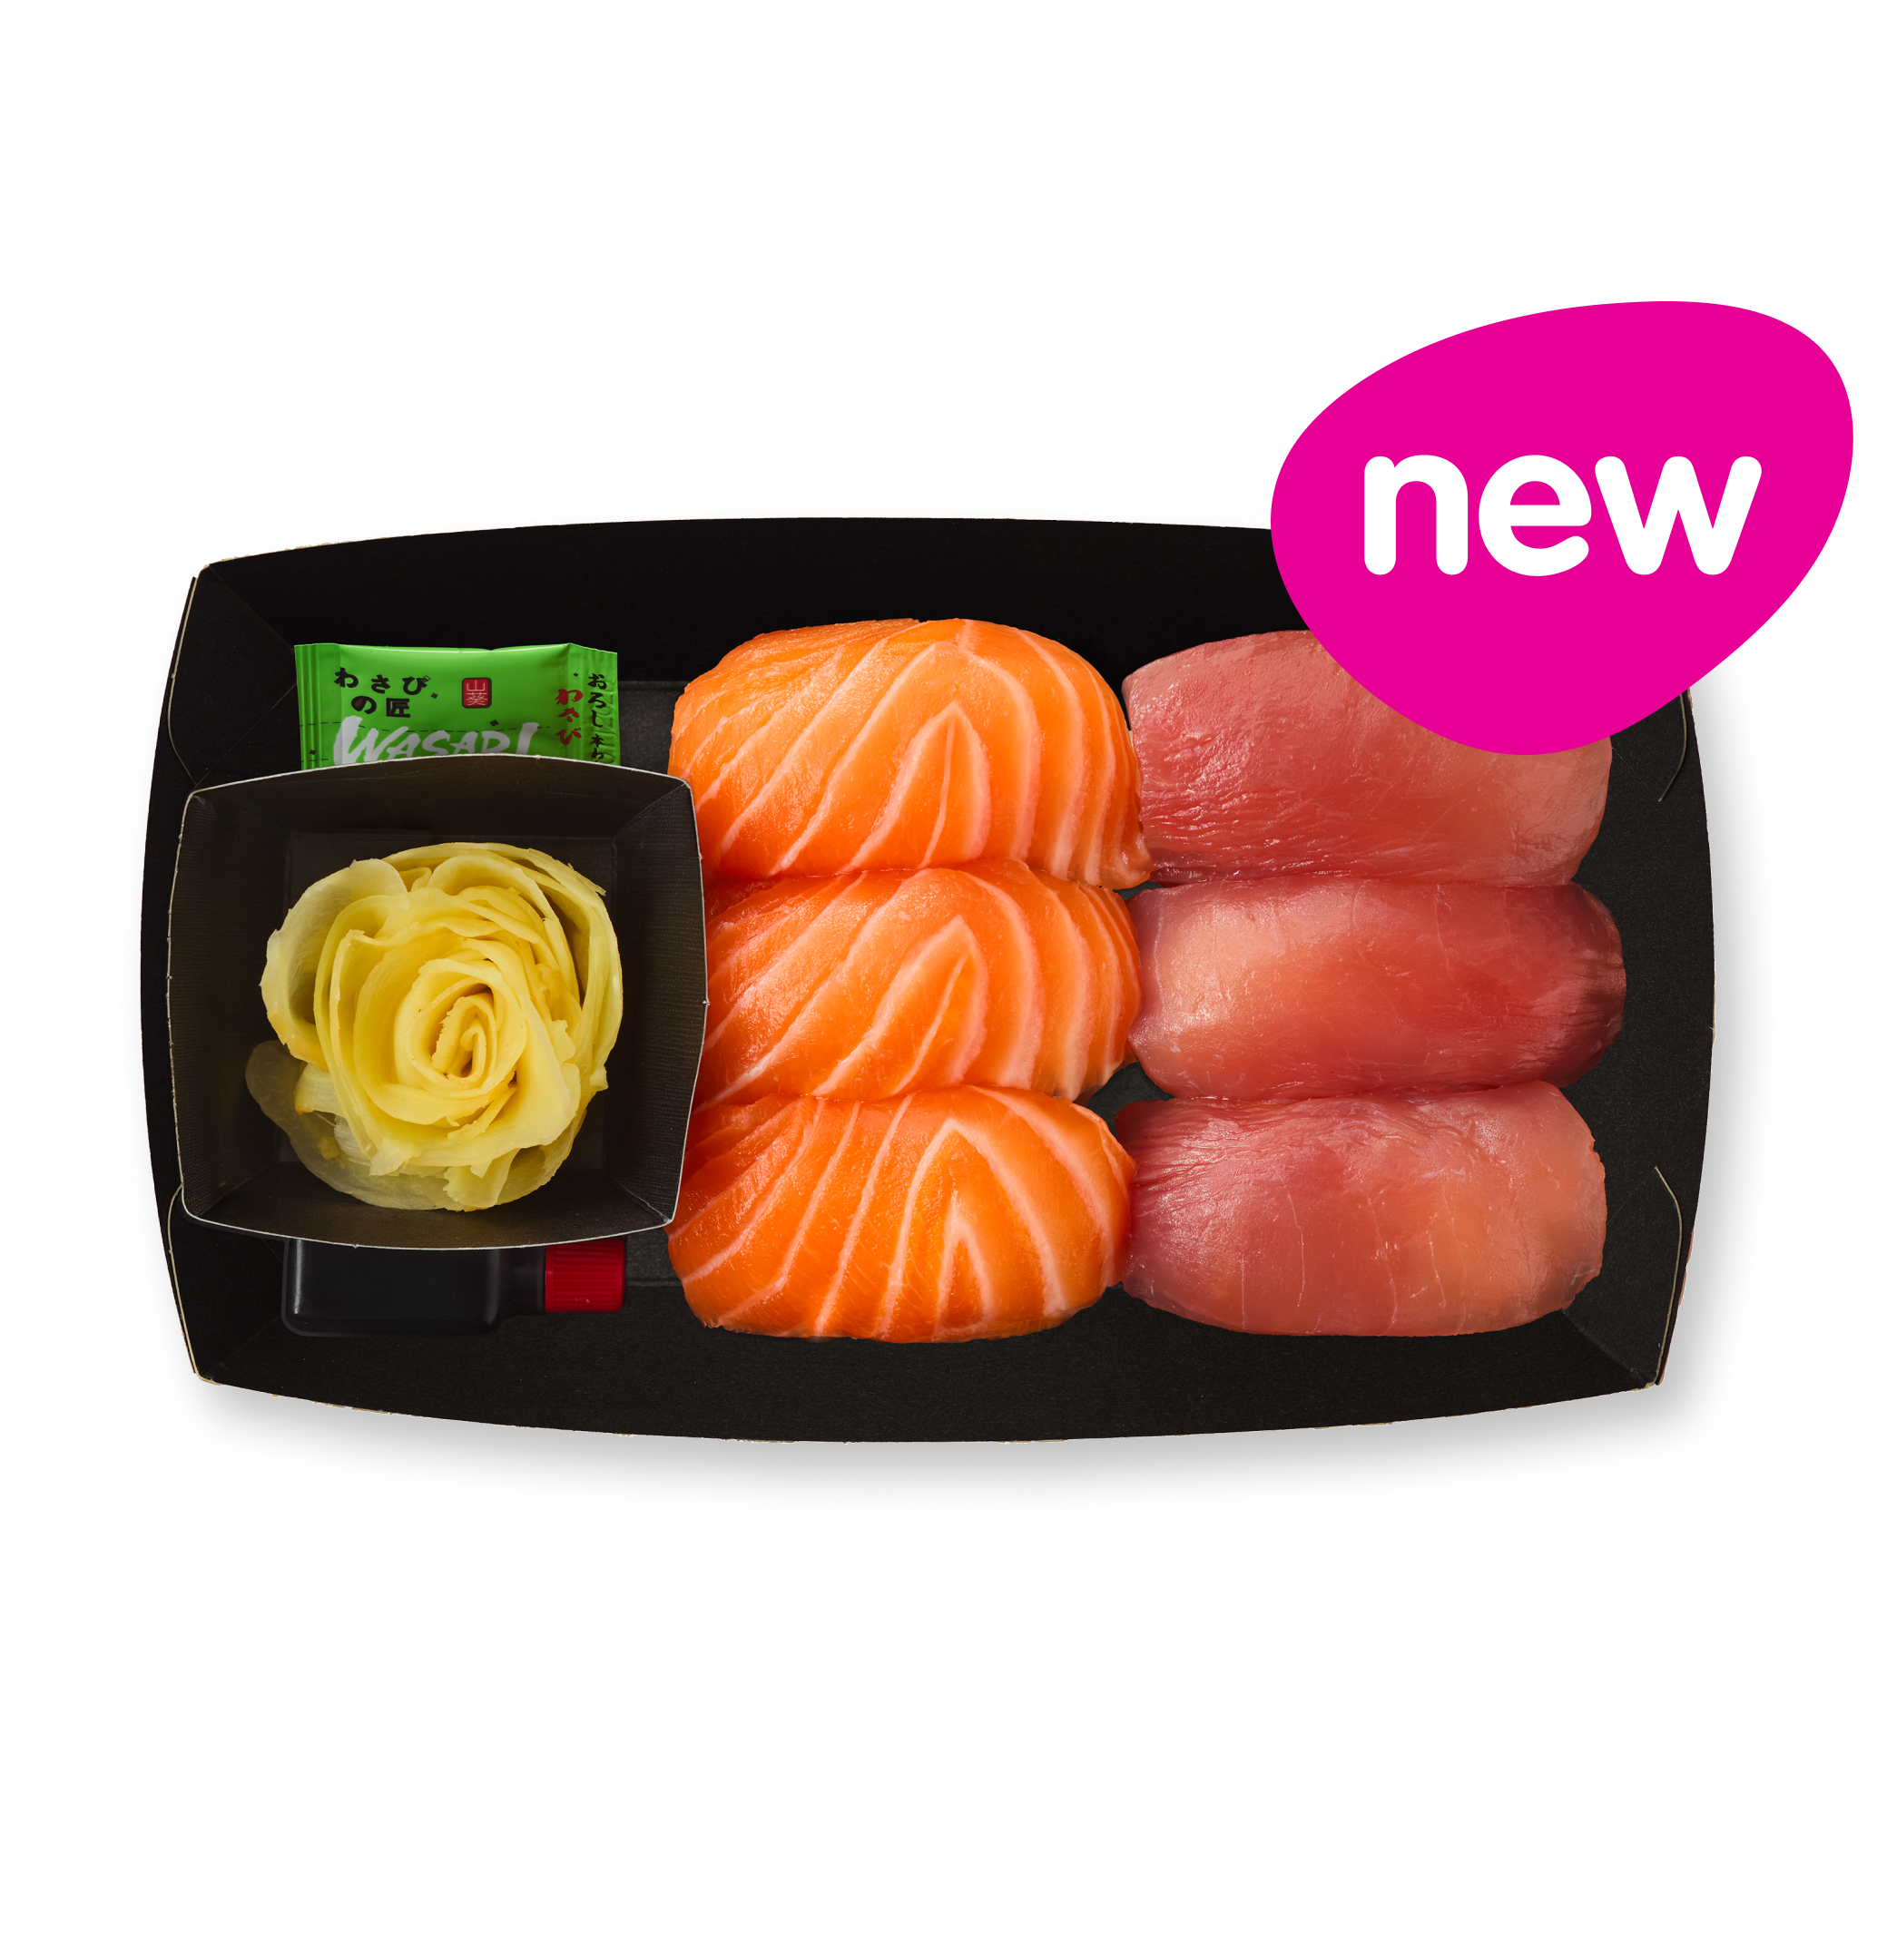 tuna & salmon sushi tuna & salmon sushi | itsu | 74 | 269 | 14.9 | 2.7 | 5.9 | 2.1 | Salt high |
| 6 | 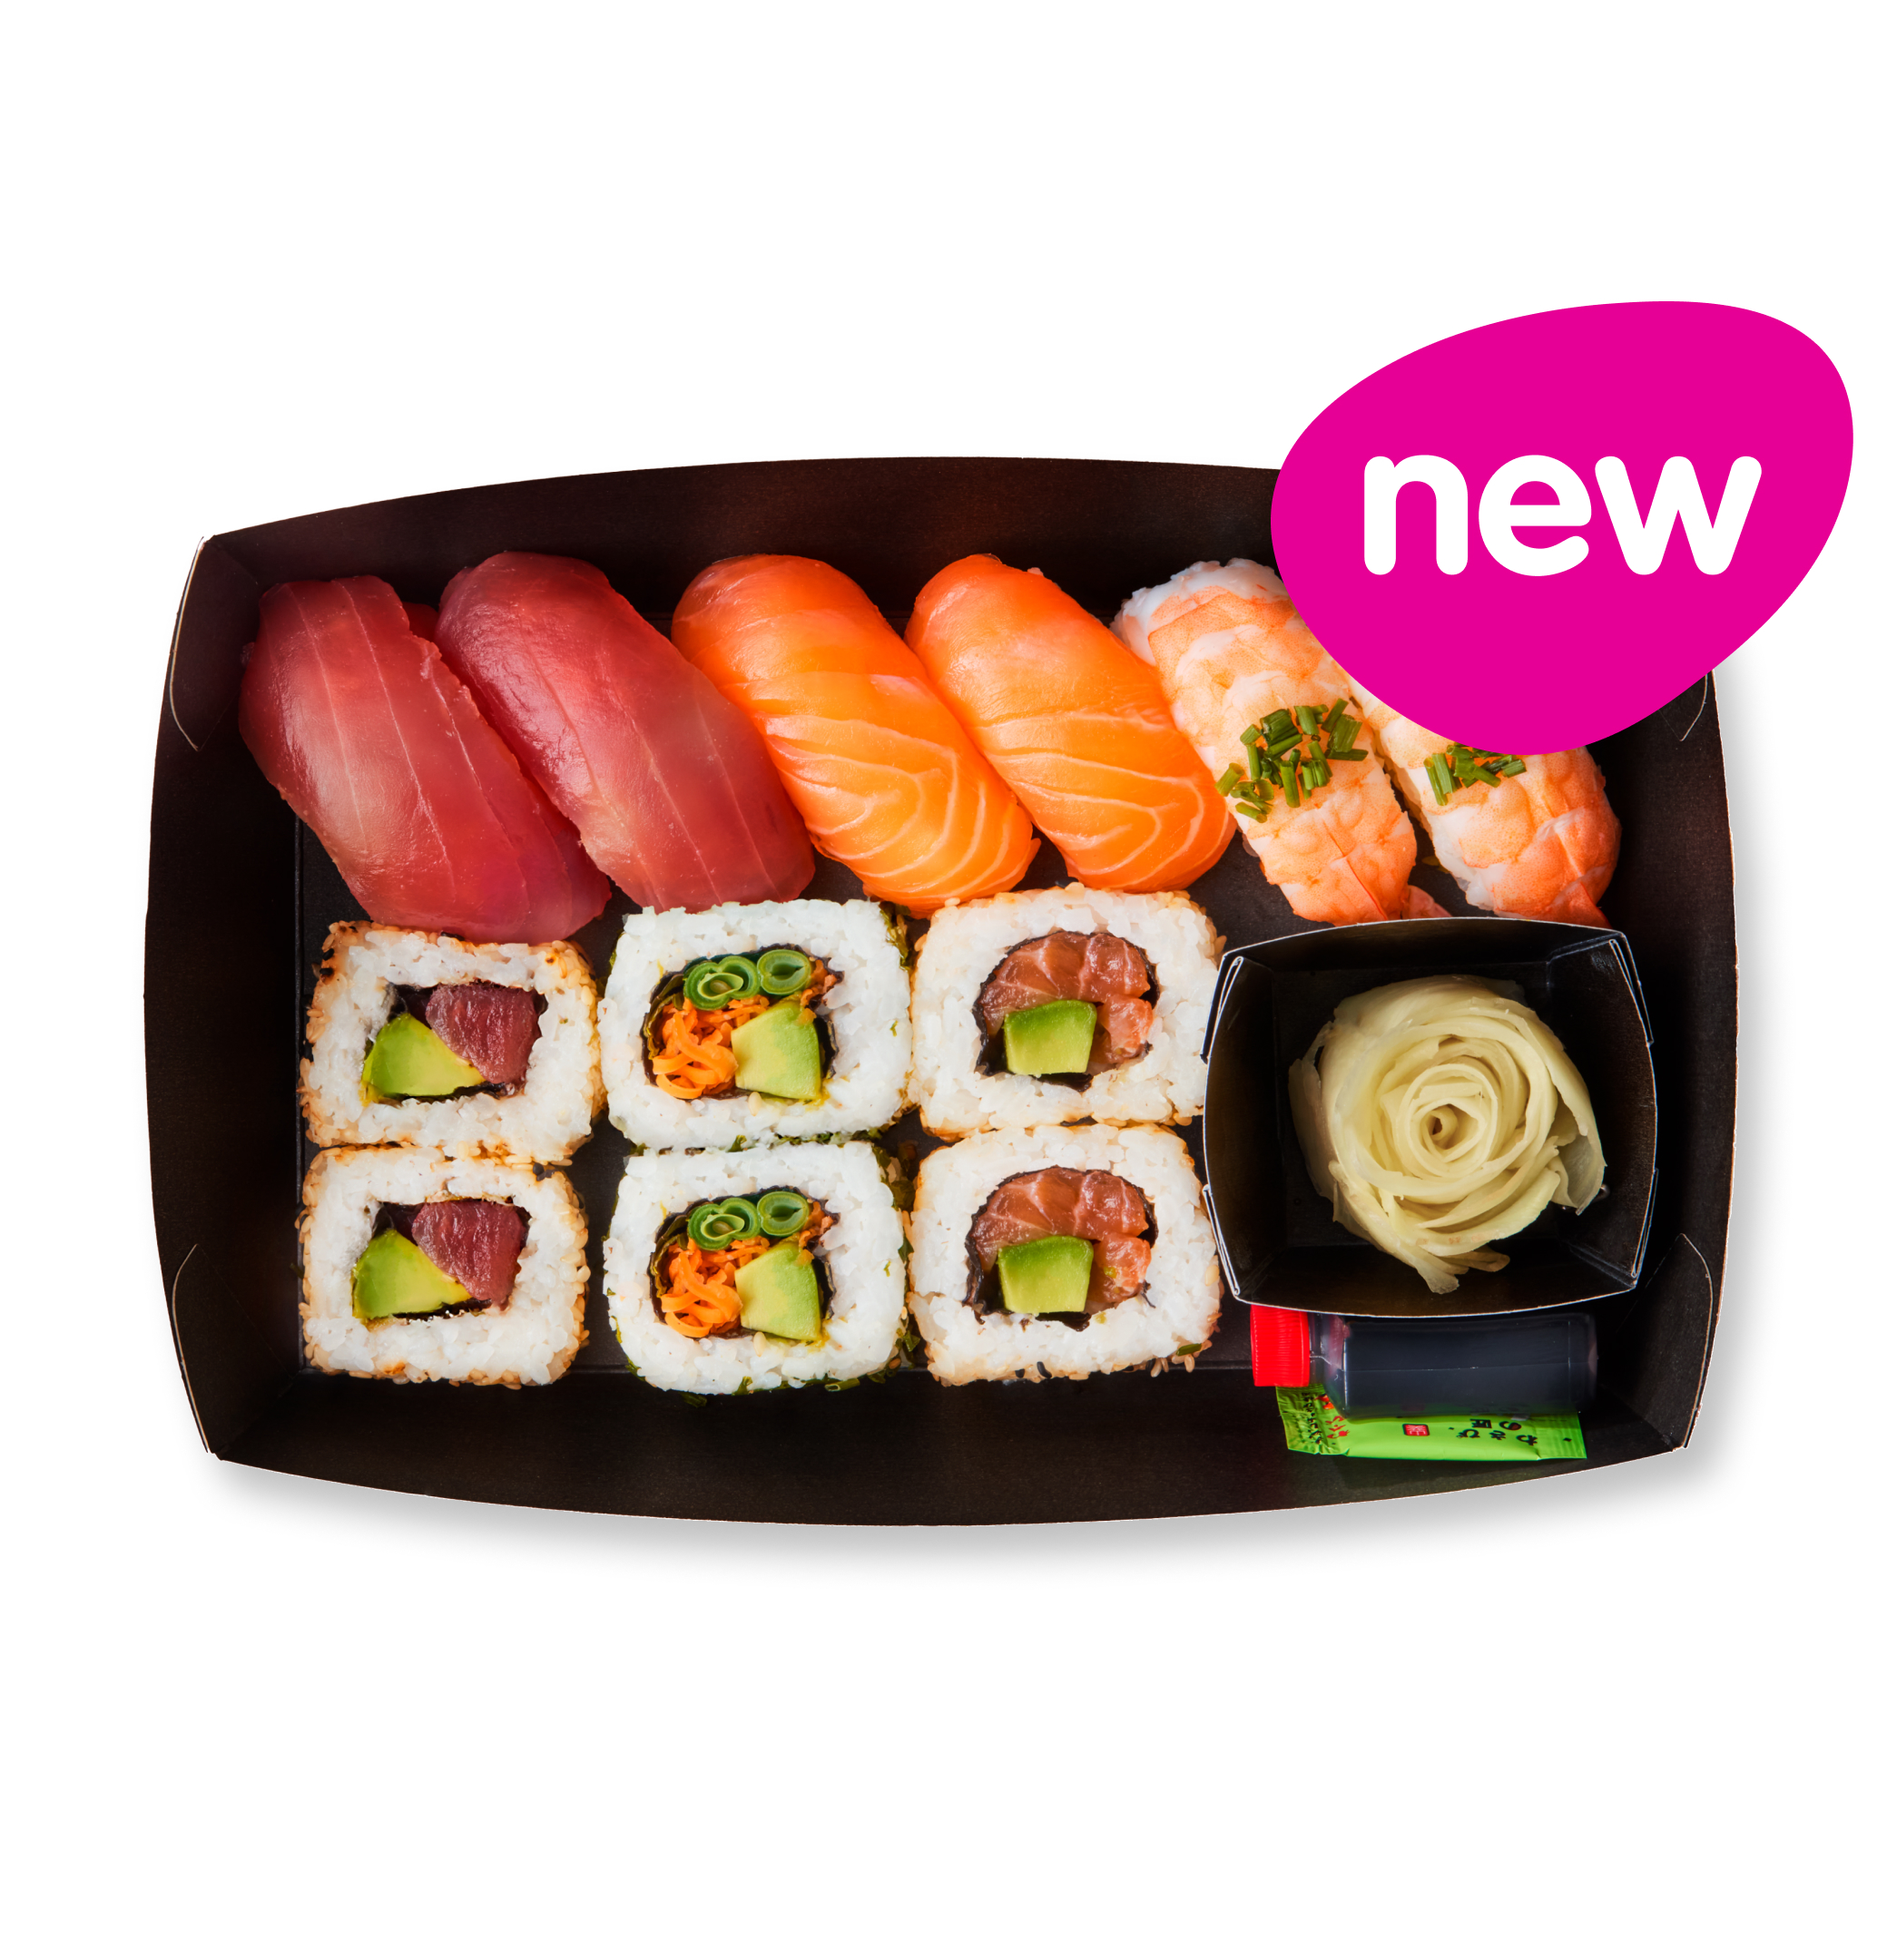 best of itsu best of itsu | itsu | 73 | 510 | 21.3 | 5.9 | 13.0 | 3.9 | Salt high |
| 7 | 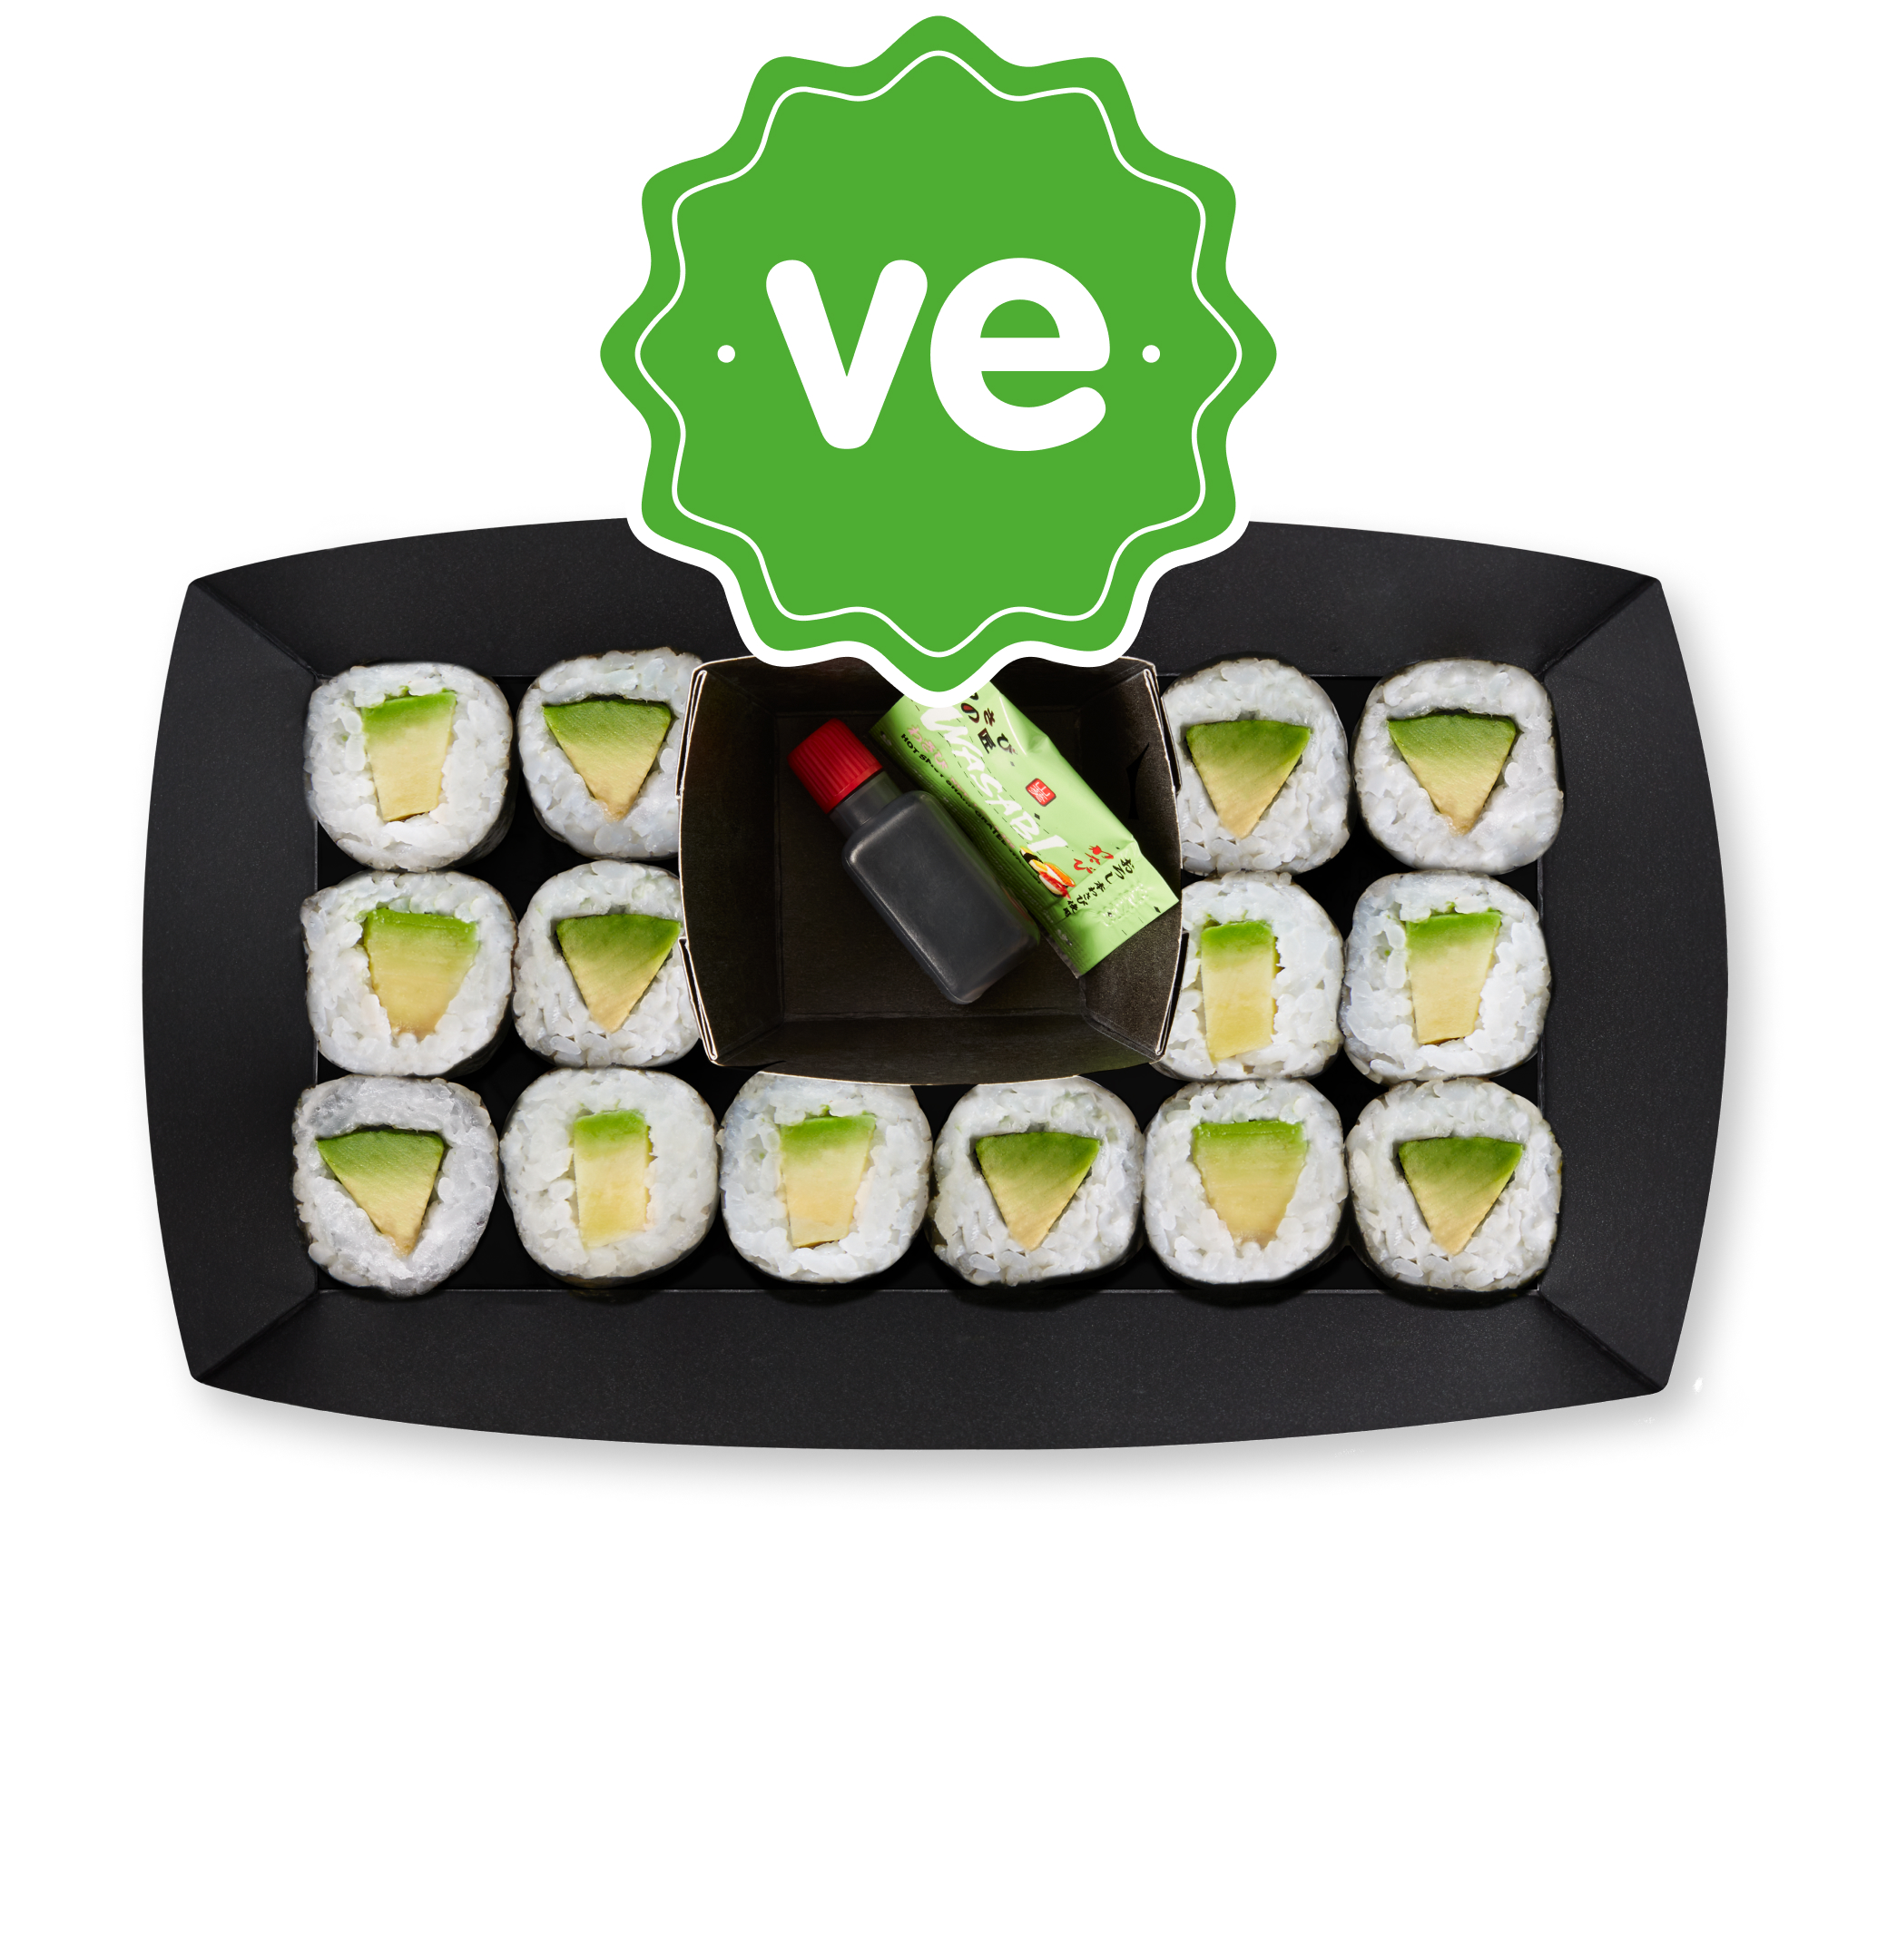 avo baby rolls avo baby rolls | itsu | 72 | 346 | 6.2 | 3.3 | 8.4 | 1.4 | - |
| 8 | 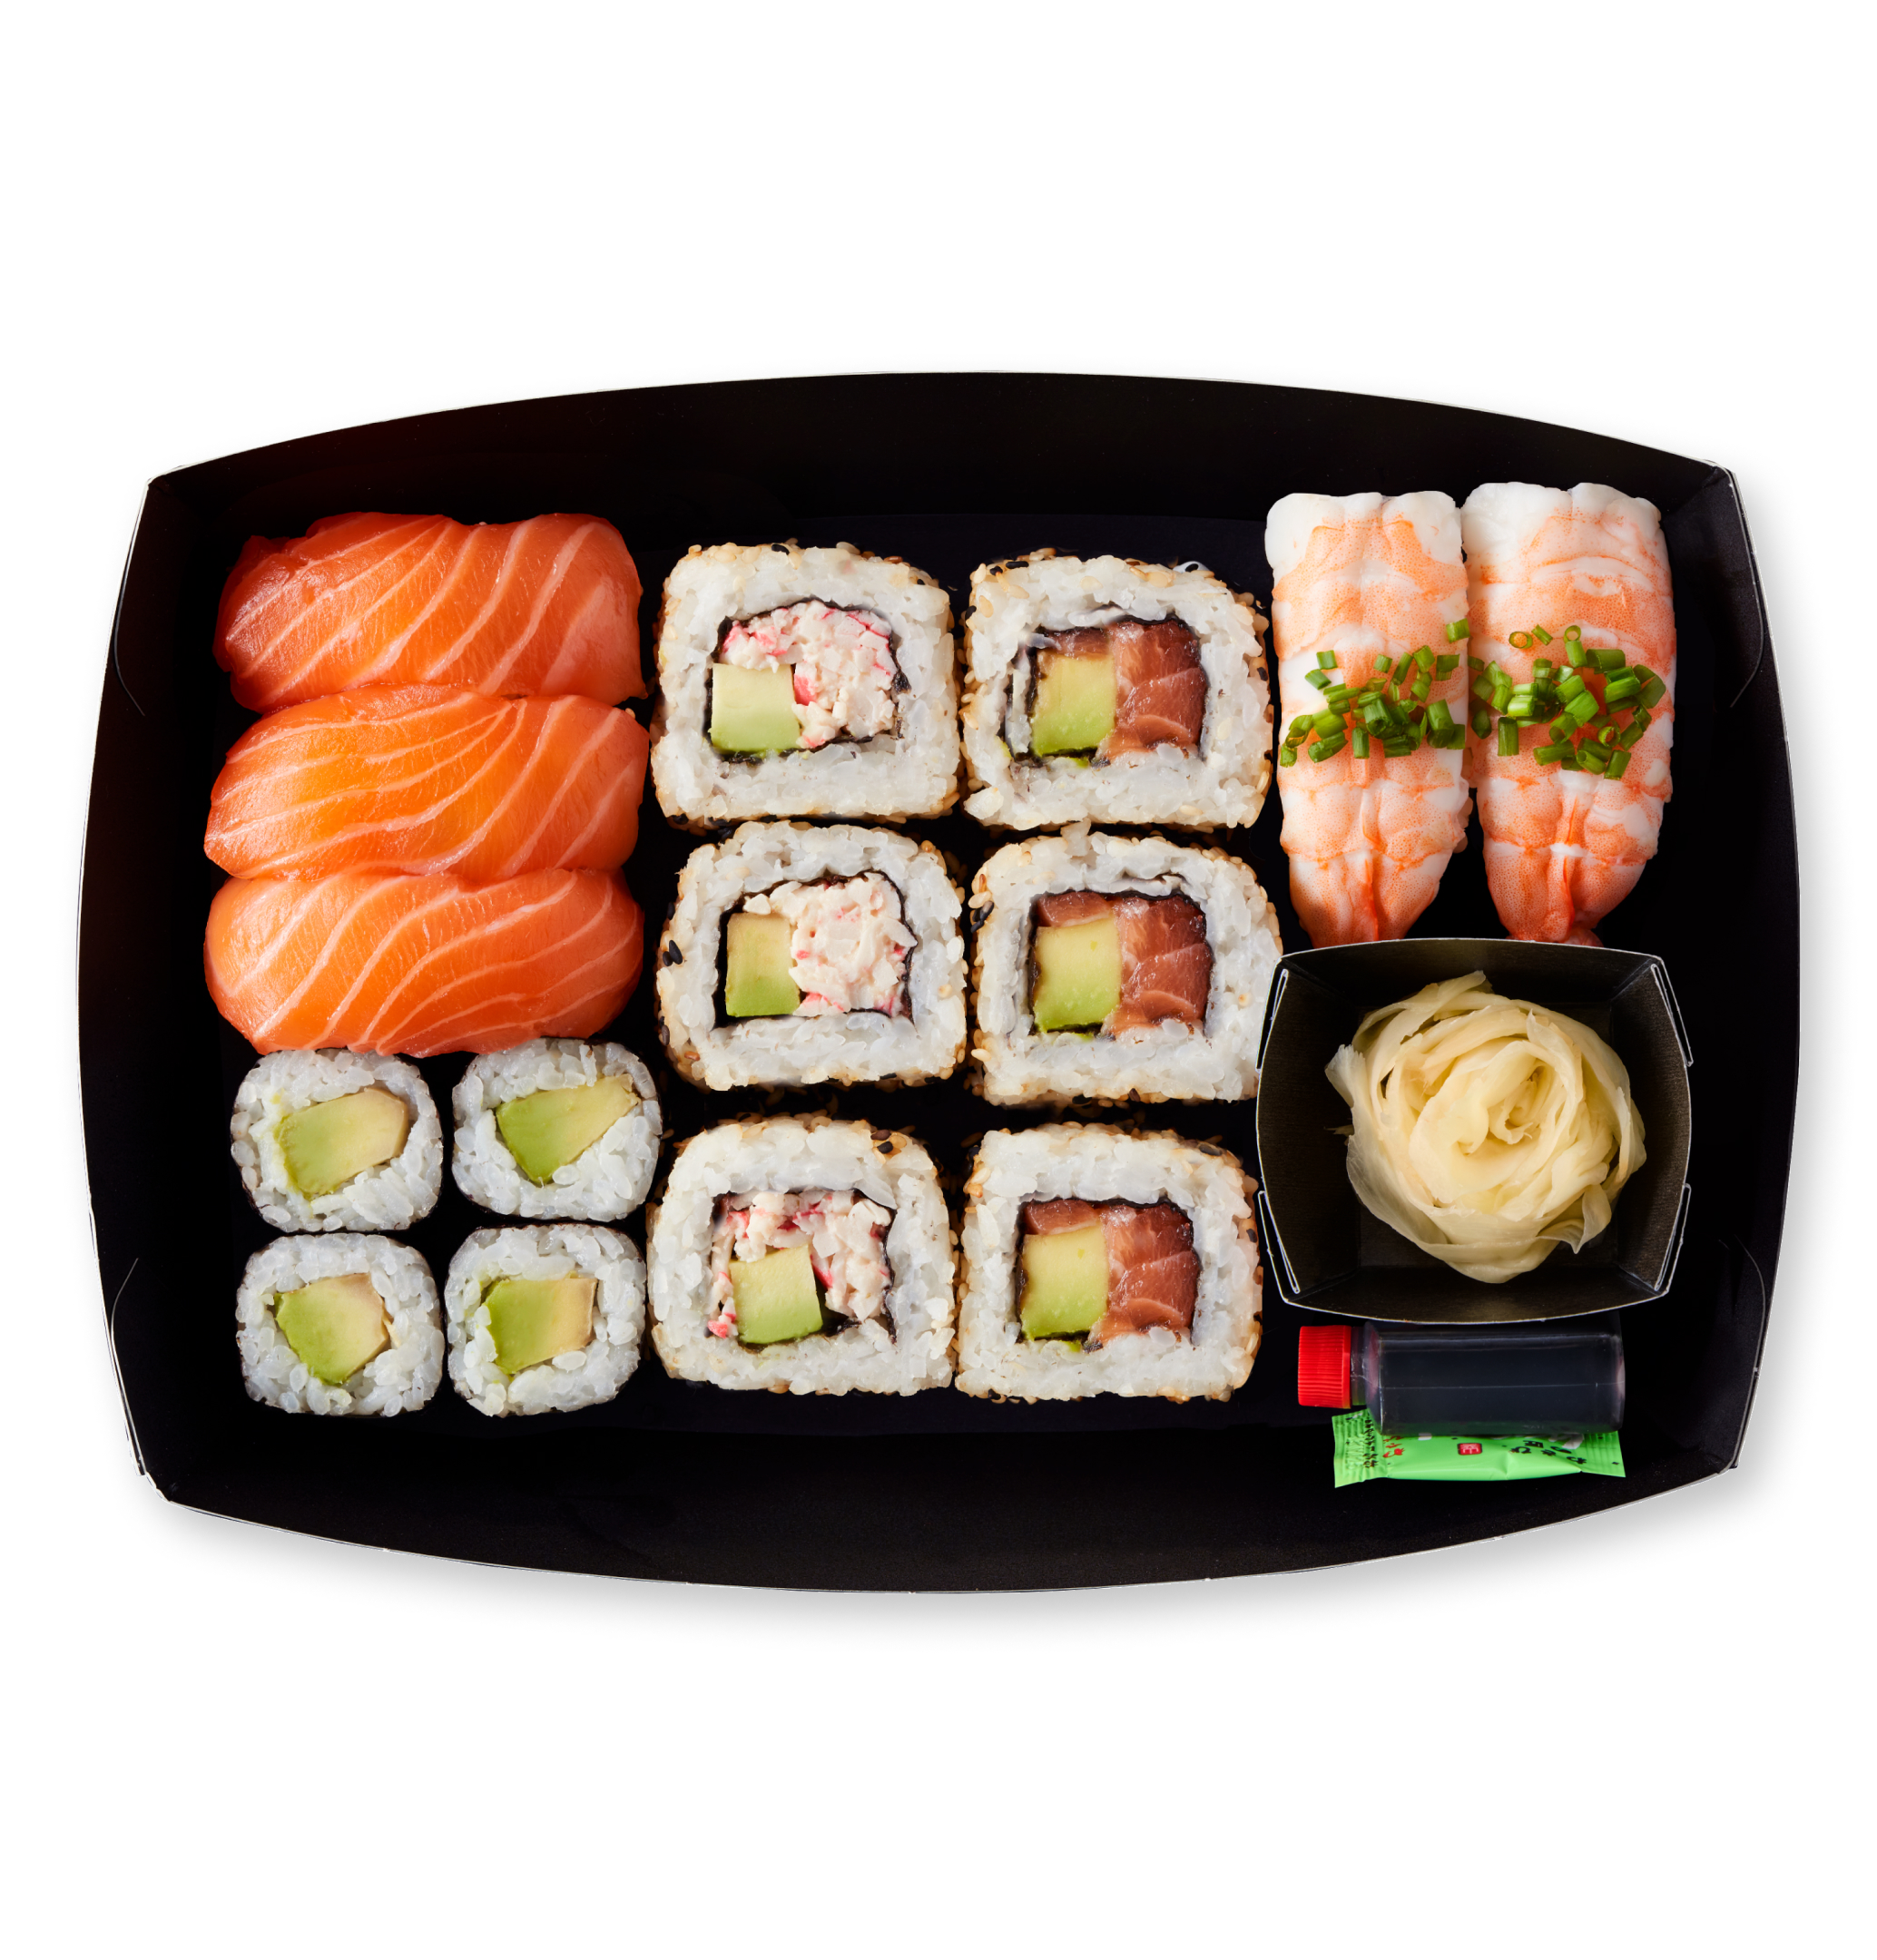 itsu classics itsu classics | itsu | 71 | 591 | 19.7 | 5.5 | 10.0 | 3.9 | Salt high |
| 9 |  California rolls California rolls | itsu | 69 | 336 | 6.5 | 3.2 | 5.6 | 2.0 | Salt high |
| 10 |  salmon full house salmon full house | itsu | 65 | 626 | 31.0 | 6.4 | 11.8 | 4.9 | Salt highScore capped |
About this ranking
Only products published on Healthier Eats and included in core rankings are listed.
Methodology summary
The Healthier Score is a nutrition-based comparison score using published per-portion nutrition data.
Scores are combined using weighted averages. High levels of salt or saturated fat can cap the final score.
View full methodology →Watch-out key
- Salt highAbove 1.8g salt per serving
- Sat fat highAbove 5g saturated fat
- Fibre n/aFibre data not provided
- Score cappedScore reduced due to salt or sat fat
Brand breakdown
Number of top 10 appearances
- itsu10
Related insights
- More coming soon.
Important
The Healthier Score is not medical advice. It is a nutrition-based comparison score only. Always check the restaurant's latest nutrition, ingredients and allergen information before ordering.
Data caveats
Nutrition data is provided by restaurant brands and may change over time. Fibre is not always published. Where missing, a conservative fibre score is used.